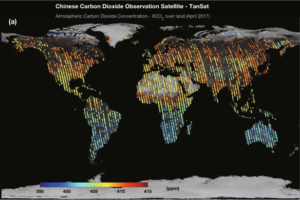
Scientists at the Chinese Academy of Sciences have put together the first global carbon dioxide maps based on data from the Chinese satellite TanSat. The satellite also measures what lead researcher Yang Dongxu calls “carbon dioxide flux,” changes in its behavior on Earth and in the Earth’s atmosphere.
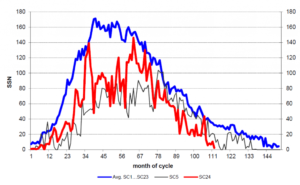
As the current solar cycle nears an end, it will go down as the weakest in close to 200 years. And as inhabitants of the northern hemisphere dig themselves out of an especially icy and snowy winter and Arctic sea ice rebounds, it may all be in part linked to low solar activity as many scientific studies have long suggested.
Figure 1: The current solar cycle no. 24 (red) compared to the mean of the previous 23 recorded solar cycles (blue) and the similar solar cycle no. 5 (black)
IBRA, Oman — In the arid vastness of this corner of the Arabian Peninsula, out where goats and the occasional camel roam, rocks form the backdrop practically every way you look.
But the stark outcrops and craggy ridges are more than just scenery. Some of these rocks are hard at work, naturally reacting with carbon dioxide from the atmosphere and turning it into stone.
Veins of white carbonate minerals run through slabs of dark rock like fat marbling a steak. Carbonate surrounds pebbles and cobbles, turning ordinary gravel into natural mosaics.
Even pooled spring water that has bubbled up through the rocks reacts with CO2 to produce an ice-like crust of carbonate that, if broken, re-forms within days.
Scientists say that if this natural process, called carbon mineralization, could be harnessed, accelerated and applied inexpensively on a huge scale — admittedly some very big “ifs” — it could help fight climate change. Rocks could remove some of the billions of tons of heat-trapping carbon dioxide that humans have pumped into the air since the beginning of the Industrial Age.
By taking a closer look, scientists find resilience in face of heat stress.
Coral reef bleaching is stark evidence of the damage being inflicted by global climate change on marine ecosystems, but a research team has found some cause for hope. While many corals are dying, others are showing resilience to increased sea surface temperatures, pointing to possible clues to the survival and recovery of these vitally important aquatic habitats (…)
Maldives Environment Minister Thoriq Ibrahim has warned that unless the Maldives gets its climate cash before 2020, the 1.5C global warming limit will be breached.
I’m not sure how the Maldives reconciles their climate concerns with all their fly-in tourism and their aggressive airport and resort building programmes, but no doubt some of that climate cash will help with the reconciliation if it ever arrives.
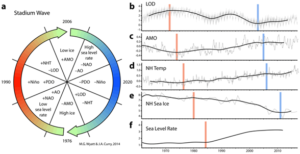
It is a well-known feature of climate change that since 1850 multiple climate datasets present a ~ 60-year oscillation. I recently wrote about it in the 7th chapter of my Nature Unbound series. This oscillation is present in the Atlantic Multidecadal Oscillation (AMO), Arctic Oscillation (AO), North Atlantic Oscillation (NAO), Pacific Decadal Oscillation (PDO), Length of Day (LOD), and Global (GST) and Northern Hemisphere (NHT) temperatures, with different lags.
To me this oscillation is not a cycle because prior to 1850 it had a more variable period and it is not well identified in LIA records. Since the origin of this oscillation is unknown, models have a hard time reproducing it and it is all but ignored by the IPCC. It is a big oscillation with an amplitude of ± 0.3 °C in NHT (0.1-0.2°C in GST; figure 2). While the long-term temperature trend is unaffected by it, there is a large effect on the 30-year trends. If this oscillation is considered, most of the climate alarmism vaporizes.
As readers here are aware, I don’t usually critique published climate papers unless they are especially important to the climate debate. Too many papers are either not that important, or not that convincing to me.
The holy grail of the climate debate is equilibrium climate sensitivity (ECS): just how much warming (and thus associated climate change) will occur in response to an eventual doubling of the CO2 concentration in the atmosphere?
Beijing has undergone several important urbanization development stages since late 1978. Linked with urbanization, the so-called “urban heat island effect” is a key problem caused by urban land expansion. Such changes in air temperature in Beijing inevitably have an impact on the daily lives of its inhabitants, and is therefore of considerable interest to scientists and the wider public alike.
Dr. Xiaojuan LIU and Associate Professor Guangjin TIAN from the School of Environment, Beijing Normal University, used the mesoscale Weather Research and Forecasting model coupled with a single urban canopy model and high-resolution land cover data to analyze the spatial and temporal patterns of summertime urban warming influenced by three stages of urban land expansion during 1990-2010 across Beijing. They found that urban-induced warming increased with urban land expansion, but the speed of warming declined slightly during 2000-10.
A paper published today in Journal of Atmospheric and Solar-Terrestrial Physics finds a “strong and stable correlation” between the millennial variations in sunspots and the temperature in Antarctica over the past 11,000 years. In stark contrast, the authors find no strong or stable correlation between temperature and CO2 over that same period.
We have thus shown
Strong correlation between solar activity and climate over the past 11,000 years of the Holocene
Strong lack of correlation between CO2 and climate over the past 11,000 years of the Holocene
Solar activity explains all 6 well-known warming periods that have occurred during the Holocene, including the current warm period
The 20th century peak in sunspot activity is associated with a 40 year lag in the peak global temperature
There has been considerable scientific investigation of the magnitude of the warming of Earth’s climate by changes in atmospheric carbon dioxide (CO2) concentration. Two standard metrics summarize the sensitivity of global surface temperature to an externally imposed radiative forcing. Equilibrium climate sensitivity (ECS) represents the equilibrium change in surface temperature to a doubling of atmospheric CO2 concentration. Transient climate response (TCR), a shorter-term measure over 70 years, represents warming at the time CO2 concentration has doubled when it is increased by 1% a year.
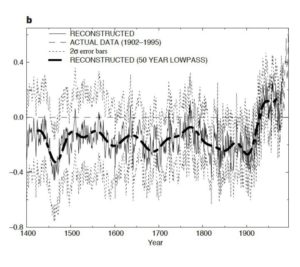
Twenty years ago today: The infamous “hockey stick” graph that crystalized global warming and ignited the climate wars was published, and became known as MBH98. The science in it was so bad, it is credited with spawning the modern climate skeptic movement.
Original “hockey stick” temperature graph in Nature, 1998. The Y axis shows the Northern hemisphere mean temperature, in degrees Celsius; the zero line corresponds to the 1902 – 1980 mean. Credit: “Global-scale Temperature Patterns and Climate Forcing over the Past Six Centuries,” by Michael E. Mann et al. in Nature, Vol. 392, April 23, 1998
New evidence from clams and mussels with temperature-sensitive habitat requirements confirm that warmer temperatures and less sea ice than today existed during the early Holocene period about 10.2–9.2 thousand years ago and between 8.2 and 6.0 thousand years ago (based on radio carbon dates) around Svalbard. Barents Sea polar bears almost certainly survived those previous low-ice periods, as they are doing today, by staying close to the Franz Josef Land Archipelago in the eastern half of the region where sea ice is more persistent (…)
by A. Stewart, April 23, 2018 in ClimateChangeDispatch
Could someone explain in 100 words or less without complex algebraic formulas how the trace gases, approximately 1% of the atmosphere can overtly control the temperatures of the remaining 99% atmospheric constituents?
SPOTLIGHT: After the Intergovernmental Panel on Climate Change (IPCC) report was released in 2007, its dramatic findings of species extinction were repeatedly emphasized by chairman Rajendra Pachauri.
BIG PICTURE: When it examined the question of species extinction, the 2007 IPCC report relied heavily on a single piece of research – a Naturecover storypublished early in 2004. Written by Chris Thomas and 18 others, this was the source of Pachauri’s claim that climate change threatened 20 to 30% of the world’s species.
In the May 2000 issue of Reason Magazine, award-winning science correspondent Ronald Bailey wrote an excellent article titled “Earth Day, Then and Now” to provide some historical perspective on the 30th anniversary of Earth Day. In that article, Bailey noted that around the time of the first Earth Day in 1970, and in the years following, there was a “torrent of apocalyptic predictions” and many of those predictions were featured in his Reason article. Well, it’s now the 48th anniversary of Earth Day, and a good time to ask the question again that Bailey asked 18 years ago: How accurate were the predictions made around the time of the first Earth Day in 1970? The answer: “The prophets of doom were not simply wrong, but spectacularly wrong,” according to Bailey.
Here are 18 examples of the spectacularly wrong predictions made around 1970 when the “green holy day” (aka Earth Day) started
Meanwhile, other scientists have been busy determining that only about 50% of the warming and sea ice losses for the Arctic region are anthropogenic, or connected to the rise in CO2 concentrations.
The rest of the warming and ice declines can be attributed to unforced natural variability.
by Tony Heller, April 20, 2018 in TheDeplorableClimSciBlog
The first half of April was third coldest in the past 110 years in the US, and the coldest since 1975. The three warmest first fifteen days of April occurred in 1910, 1930 and 1925, when about 80% of days were over 60 degrees.
I’ve been regularly bringing you climate and energy news from Germany, with Kenneth in USA posting on the latest science.
Now NoTricksZone is happy to report we are also working with skeptic Japanese climate blogger Kirye, who runs KiryeNet. This means we’ll also be occasionally presenting skeptic news out of Japan in English.
For example in last Tuesday’s post Kirye delivered the key parts on the Arctic Freezamageddon. Our aim is to provide more of such posts in the future.
Views from other countries like Japan are always extremely useful. There really isn’t any global climate science consensus. It’s fraudulent to claim that there is.
In today’s post I am going to go over how I went about creating a reconstruction of the history of temperature from the GHCN data sets using a variable number of stations reporting each year for the years of 1900 to 2011. Before I go into the details of that reconstruction, let me cover how I went about discarding some alternative methods.
I decided to create a test case for reconstruction methods by picking five random, complete station records. I then deleted a portion of one of those records. I mimicked actual record conditions within the GHCN data so my testing would be realistic. In different trials I deleted all but the last 20 years, all but the first 20 years or some number of years in the middle. I tried normalizing each station to its own average and averaging the anomalies. I tried averaging the four complete stations, then normalizing the fourth station by its average distance from the main average. In all cases when I plotted the reconstruction against the true average the errors were quite large.normalizing the fourth station by its average distance from the main average. In all cases when I plotted the reconstruction against the true average the errors were quite large.
The scientific uncertainties associated with climate prediction are the basis of most of the arguments about the significance of climate change(25), and as well are the basis of much of the polarized public opinion on the political aspects of the matter. Perhaps the most fundamental of the uncertainties can be illustrated by reference to a simple ‘thought experiment’ as follows.
La Global Warming Policy Foundation (GWPF) a publié son rapport sur l’état du climat pour 2017. Etabli par Ole Humlum, Professeur émérite à l’Université d’Oslo, ce rapport est un examen complet du climat mondial.
En voici les 10 principales conclusions :
1. Il est probable que 2017 ait été une des années les plus chaudes depuis le début des mesures instrumentales en 1850, moins chaude cependant que 2016.
2. À la fin de l’année 2017, la température moyenne à la surface de la planète avait retrouvé les niveaux antérieurs à l’épisode El Niño. Cela montre que la hausse récente des températures mondiales a été causée principalement par ce phénomène océanographique dans le Pacifique. Cela suggère aussi que le « hiatus » se poursuivra dans les années à venir.
When discussing climate with people who do not have technical backgrounds, I have learned much of the climate discussion is a foreign language to them.
So, I take them through a few examples of how much energy is involved and how miniscule human activity is by comparison. Done properly, this lets a non-STEM person grasp the huge amounts of energy involved.
One of my favorites is Anthony’s essay that debunks the Hiroshima equivalent alarmism:
