Archives de catégorie : unclassified

New Study: Rising CO2 Drives Post-1980s Greening…Which Cools The Earth And Offsets 29% Of Human Emissions

by Haverd et al., 2020 in NoTricksZone/K. Richard


About 70% of the Earth’s post-1980s vegetative greening trend has been driven by CO2 fertilization. More greening has offset or reversed 29% of recent anthropogenic CO2 emissions. Greening also has a net cooling effect on surface temperatures.

Earlier this year we highlighted a study (Haverd et al., 2020) asserting rising CO2 and warming are the dominiant drivers of Earth’s strong post-1980s greening trend. This greening expands Earth’s carbon sink so profoundly that by 2100 the greening of the Earth will offset 17 years (equivalent) of anthropogenic CO2 emissions.

A 17% offset over 80 years, or net CO2 emissions reversal, would easily supplant the effectiveness of Paris climate accord CO2 mitigation policies.

Now another new study (Piaoet et al., 2020) expands upon these same principles, further suggesting the net effect of more CO2-driven greening is more cooling and carbon sink expansion.

Since the 1980s, 29% of human CO2 emissions were cancelled out by the CO2-induced greening of the Earth. The post-2000 vegetative greening expansion has been so massive (5.4 million km²) its net areal increase is equivalent to a region the size of the Amazon rainforest.

“Vegetation models suggest that CO2 fertilization is the main driver of greening on the global scale, with other factors being notable at the regional scale. Modelling indicates that greening could mitigate global warming by increasing the carbon sink on land and altering biogeophysical processes, mainly evaporative cooling.”

During The Last Glacial Maximum Fires Were 10 Times More Common And Summer Temps 3-4°C Warmer Than Today

by K. Richard, August 3, 2020 in NoTricksZone


A new study finds that 26 to 19 thousand years ago, with CO2 concentrations as low as 180 ppm, fire activity was an order of magnitude more prevalent than today near the southern tip of Africa – mostly because summer temperatures were 3-4°C warmer.

We usually assume the last glacial maximum – the peak of the last ice age – was signficantly colder than it is today.

But evidence has been uncovered that wild horses fed on exposed grass year-round in the Arctic, Alaska’s North Slope, about 20,000 to 17,000 years ago, when CO2 concentrations were at their lowest and yet “summer temperatures were higher here than they are today” (Kuzmina et al., 2019). Horses had a “substantial dietary volume” of dried grasses year-round, even in winter at this time, but the Arctic is presently “no place for horses” because there is too little for them to eat, and the food there is to eat is “deeply buried by snow” (Guthrie and Stoker, 1990).

In a new study (Kraaij et al., 2020) find evidence that “the number of days per annum with high or higher fire danger scores was almost an order of magnitude larger during the LGM [last glacial maximum, 19-26 ka BP]  than under contemporary conditions” near Africa’s southernmost tip, and that “daily maximum temperatures were 3-4°C higher than present in summer (and 2-4°C lower than present in winter), which would have contributed to the high severity of fire weather during LGM summers.”

Neither conclusion – that surface temperatures would be warmer or that fires would be more common – would seem to be consistent with the position that CO2 variations drive climate or heavily contribute to fire patterns.

Settled Science? New Climate Study Shifts the Goalposts to 2.6-3.9C

by Eric Worall, July 24, 2020 in WUWT


A new climate study has dismissed utterly implausible high end climate models. But the new study also seeks to raise the low end of the range of estimated climate sensitivity into the discomfort zone.

The treatment of cloud feedback is interesting. The study acknowledges large cloud feedback uncertainties, mentions the Lindzen et al. (2001) “iris effect”, and admits GCMs cannot be trusted to reproduce observed cloud response, yet still appears to attempt to derive a cloud feedback factor based on satellite observations, and mix this observational cloud factor with model predictions.

The treatment of clouds may turn out to be one of the most controversial assumptions in the study – as Pat Frank has pointed out on a number of occasions, the magnitude of model cloud response error is significantly greater than the CO2 driven warming which models attempt to project, which calls into question whether climate models have any predictive skill whatsoever.

To the author’s credit they have described their method in great detail, so I’m looking forward to detailed responses to this study.

Climate alarmism versus integrity at National Academies of Science

by D. Wojick, June28, 2020 in WUWT


National Academies of Science should speak out against climate alarmism, not support it. This is the major message in a recent letter from Professor Guus Berkhout, president of CLINTEL, to the new head of the Royal Netherlands Academy of Arts and Sciences. The integrity of science is at stake.

This letter is a model for how all alarmist National Academies should be addressed. For example, the US National Academy of Sciences (NAS) is painfully alarmist. Even worse, NAS has been joined in promoting alarmism by its two siblings, the National Academies of Engineering and Medicine. The fact that these Academies have become a servant of supranational political organizations such as IPCC shows how serious the crisis in climate science really is.

The Netherlands Academy is called KNAW, from its Dutch name. KNAW was established in 1808 as an advisory body to the government, a task it still performs today. NAS was established by Congress in 1868. Both NAS and KNAW derive their authority from their high profile members, rigorously selected top scientists from a large range of scientific fields. Professor Berkhout is a member of KNAW.

The letter is addressed to Prof. Dr. Ineke Sluiter, President of KNAW. It begins with a clear statement of the issue:

I am addressing you in your capacity as the new President of the KNAW because the climate issue is escalating. The IPCC and the associated activist climate movement have become highly politicised. Sceptical scientists are being silenced. As an IPCC expert reviewer, I critically looked at the latest draft climate report. My conclusion is that there is little evidence of any intent to discover the objective scientific truth.

Siberian Heatwave–Climate Or Weather?

by P. Homewood, June 27, 2020 in NotaLotofPeoppleKnowThat


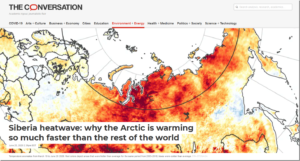
The Conversation has now got involved in the Arctic heatwave scare, with this article by Jonathan Bamber, Professor of Physical Geography, University of Bristol :

On the eve of the summer solstice, something very worrying happened in the Arctic Circle. For the first time in recorded history, temperatures reached 38°C (101°F) in a remote Siberian town – 18°C warmer than the maximum daily average for June in this part of the world, and the all-time temperature record for the region.

New records are being set every year, and not just for maximum temperatures, but for melting ice and wildfires too. That’s because air temperatures across the Arctic have been increasing at a rate that is about twice the global average.

All that heat has consequences. Siberia’s recent heatwave, and high summer temperatures in previous years, have been accelerating the melting of Arctic permafrost. This is the permanently frozen ground which has a thin surface layer that melts and refreezes each year. As temperatures rise, the surface layer gets deeper and structures embedded in it start to fail as the ground beneath them expands and contracts. This is what is partly to blame for the catastrophic oil spill that occurred in Siberia in June 2020, when a fuel reservoir collapsed and released more than 21,000 tonnes of fuel – the largest ever spill in the Arctic.

So what is wrong with the Arctic, and why does climate change here seem so much more severe compared to the rest of the world?

https://theconversation.com/siberia-heatwave-why-the-arctic-is-warming-so-much-faster-than-the-rest-of-the-world-141455

Scientists Panic, Because Arctic Is 0.4F Warmer Than In 1915!

by P. Homewood, June 21, 2020 in NotaLotofPeopleKnowThat


The Arctic is thought to have recorded its hottest ever temperature of 100.4F (38C) in Siberia, an astonishing 32F (18C) above the normal level for this time of year.

The mercury shot up to the unprecedented level in Verkhoyansk, 3,000 miles east of Moscow, as the region endures a summer heatwave.

Scientists had predicted the Arctic wouldn’t reach these levels until 2100, meaning it is warming 80 years faster than previously thought.

If the record is confirmed it will represent a new high. The current record for hottest temperature in the Arctic is held by Prospect Creek, Alaska, which recorded 100F (38C) in 1915.

Weatherman for CBS, Jeff Beradelli, said on Twitter yesterday: ‘Likely the hottest temperature ever recorded in the Arctic happened today.

‘What’s happening in Siberia this year is nothing short of remarkable. For perspective, Miami has only reached 100F (38C) once on record.’

https://www.dailymail.co.uk/news/article-8444319/Arctic-records-hottest-temperature-mercury-hits-100F-town-Verkhoyansk-Siberia.html?login#readerCommentsCommand-message-field


Even the babies who write for the Mail could surely spot the fly in the ointment – that this new record is only 0.4F higher than the previous one set in 1915! Hardly the apocalypse they are trying to present.

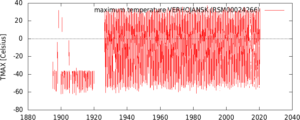
As for Verkhoyansk itself, temperatures there reached 37.3C (99.1F) in 1988 during a succession of 30C+ days, so again there is nothing remarkable about the latest weather at all :

MAN-MADE GLOBAL WARMING DESTROYED IN 500 WORDS, BY GEOLOGIST DR ROGER HIGGS

by Cap Allon, May 27, 2020 in Electroverse


INTERGOVERNMENTAL PANEL ON CLIMATE CHANGE IPCC) THREE PILLARS OF MAN-MADE GLOBAL WARMING: COLLAPSED — by Dr Roger Higgs (DPhil Oxford, geology, 1982-86), Geoclastica LtdTechnical Note 2020-7, 25th May 2020, amended 26-5-2020 on ResearchGate.

The IPCC says ongoing warming is due to man’s CO2 emissions, hence ‘Anthropogenic Global Warming’ (AGW). However, the 3 pillars on which they base this claim are unscientific and quickly disproved.

Continuer la lecture de MAN-MADE GLOBAL WARMING DESTROYED IN 500 WORDS, BY GEOLOGIST DR ROGER HIGGS

Tendencies, variability and persistence of sea surface temperature anomalies

by Bulgin et al., May 14, 2020 in Nature OPEN ACCESS


Abstract

Quantifying global trends and variability in sea surface temperature (SST) is of fundamental importance to understanding changes in the Earth’s climate. One approach to observing SST is via remote sensing. Here we use a 37-year gap-filled, daily-mean analysis of satellite SSTs to quantify SST trends, variability and persistence between 1981–2018. The global mean warming trend is 0.09 K per decade globally, with 95% of local trends being between −0.1 K and + 0.35 K. Excluding perennial sea-ice regions, the mean warming trend is 0.11 K per decade. After removing the long-term trend we calculate the SST power spectra over different time periods. The maximum variance in the SST power spectra in the equatorial Pacific is 1.9 K2 on 1–5 year timescales, dominated by ENSO processes. In western boundary currents characterised by an intense mesoscale activity, SST power on sub-annual timescales dominates, with a maximum variance of 4.9 K2. Persistence timescales tend to be shorter in the summer hemisphere due to the shallower mixed layer. The median short-term persistence length is 11–14 days, found over 71–79% of the global ocean area, with seasonal variations. The mean global correlation between monthly SST anomalies with a three-month time-lag is 0.35, with statistically significant correlations over 54.0% of the global oceans, and notably in the northern and equatorial Pacific, and the sub-polar gyre south of Greenland. At six months, the mean global SST anomaly correlation falls to 0.18. The satellite data record enables the detailed characterisation of temporal changes in SST over almost four decades.

 …

NOAA Satellite records second largest 2-month temperature drop in history

by Anthony Watts, May 1, 2020 in WUWT


UPDATE: Changed emphasis from Northern Hemisphere extratropics to entire Northern Hemisphere (h/t John Christy)

In April, 2020, the Northern Hemisphere experienced its 2nd largest 2-month drop in temperature in the 497-month satellite record.

The Version 6.0 global average lower tropospheric temperature (LT) anomaly for April, 2020 was +0.38 deg. C, down from the March, 2020 value of +0.48 deg. C.

The Northern Hemisphere temperature anomaly fell from +0.96 deg. C to 0.43 deg. C from February to April, a 0.53 deg. C drop which is the 2nd largest 2-month drop in the 497-month satellite record. The largest 2-month drop was -0.69 deg. C from December 1987 to February 1988.


RECORD SNOWFALL BURIES UPPER MIDWEST — SIERRA NEVADA MOUNTAINS TO SEE 4-FEET ON SUNDAY — NH SNOW MASS 500 GIGATONS ABOVE 1982-2012 AVERAGE

by Cap Allon, April 5, 2020 in Electroverse


According to abcnews.go.com and the NWS, seven states from Minnesota to Kansas were under ice and snow alerts on Friday, while forecasts for the West see 4-feet of snow falling over the Sierra through Sunday alone.

Thursday, April 2 saw record Spring snowfall bury the Upper Midwest.

In Grand Forks, North Dakota, a whopping 10 inches (25.4 cm) of global warming goodness was measured; while Fargo, North Dakota, saw snow totals touch 5 inches (12.7 cm).

Wyoming was handed the largest accumulations — a recording busting 21 inches (53.3cm).

This cold front continued its slow southerly march overnight Thursday, and reached southeastern Texas by Friday afternoon — the biggest impacts here were severe thunderstorms, damaging winds, golf-ball size hail, and the odd tornado. Heavy rain also reportedly produced some flash flooding.

A new storm rolled into the West Coast on Saturday bringing heavy rain to the California coast. Looking forward to Sunday, staggering April snow totals of up to 4 FEET are forecast to bury the Sierra Nevada Mountains:

The significance of these snow totals cannot be overemphasized.

This is how glaciers form.

This is also how ice ages begin.

The COLD TIMES are returning in line with historically low solar activitycloud-nucleating Cosmic Rays, and a meridional jet stream flow.

Even NASA agrees, in part at least, with their forecast for this upcoming solar cycle (25) revealing it will be “the weakest of the past 200 years,” with the agency correlating previous solar shutdowns to prolonged periods of global cooling here.

El Nino & Arctic Warming In the 1930s

by P. Homewood, April 5, 2020 in NotaLotofPeopleKnowThat


Just following up on Joe Bastardi’s article yesterday about El Ninos and Arctic warming, it is worth looking at longer term trends.

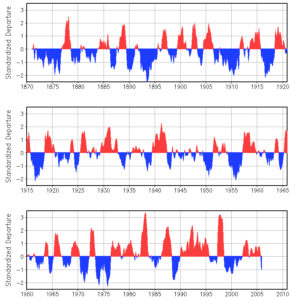
Below is the chart of the MEI, with red indicating El Ninos and blue La Ninas.:

Extended Multivariate ENSO Index

https://www.esrl.noaa.gov/psd/enso/mei.ext/

As we can see, the period 1925 to 1945 was dominated by powerful El Ninos. This of course was also the time of great warming in the Arctic, known as “The Warming in The North”, when temperatures across much of the Arctic were as high as they are now.

During the 1950s, a much colder climate took over in the Arctic, until it became warmer again in the 90s. This was also a period when La Ninas dominated.

Coincidence?

The climate in the Arctic is also very well correlated with the Atlantic Multidecadal Oscillation (AMO):

Continuer la lecture de El Nino & Arctic Warming In the 1930s

Denman Glacier–Latest Antarctic Meltdown Scare

by P. Homewood, March 24, 2020 in NotaLotofPeopleKnowThat


Scientists have found a new point of major vulnerability in the Antarctic ice sheet, in a region that already appears to be changing as the climate warms and has the potential to raise sea levels by nearly five feet over the long term.

Denman glacier, in East Antarctica, is a 12-mile-wide stream of ice that flows over the deepest undersea canyon in the entire ice sheet before spilling out into the ocean. That subsea trough is more than 2 miles deep, or double the average depth of the Grand Canyon. While there are far deeper trenches in the open ocean, such as the Marianas Trench, in this case the extreme undersea topography lies right on the outer fringe of the Antarctic continent — making it the “deepest continental point on Earth.”

In reality the scientists who wrote this study do not have a clue whether the retreat of the Denman is anything new or not, or whether the deep ocean temperatures are any warmer than before 1979. Or whether what they are observing is just a natural process.


We can then go on to explore sea level implications.

They claim that since 1979, 250 billion tonnes of ice has been lost, equivalent to 0.5mm of sea level rise. In other words, 1.3mm/C, hardly cataclysmic.

They then go on to talk about a potential loss of 540 trillion tonnes, raising sea levels by 5 feet. Yet at current rates, it would take 86400 years for this to occur!

As always with these sort of studies, the authors refuse to say how long all this will take to happen.


ESA STUDY REVEALS THE 2019 “HORRIFIC” AMAZON FIRE SEASON WAS ACTUALLY INLINE WITH THE 2001-2018 AVERAGE

by Poppaloff, March11, 2020 in Electroverse


Never has the phrase “don’t believe the hype” been so relevant.

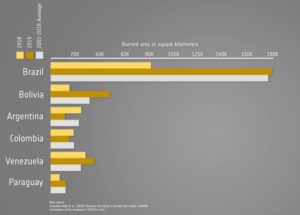
Last year media outlet after media outlet pumped the horror of the fires in the Amazon: “The Earth is burning up – The Earth is burning up.” However, the latest study released from the ESA points to the fact that last year’s burn, although 70% up on the previous year, was in fact in line with the previous seventeen years of acreage burn figures.

“While forest fires are common in the Amazon, they vary considerably from year-to-year driven by changes in climate, as well as variations in deforestation and forest degradation,” the ESA wrote.

The 2019 fires triggered an international demand for updated information about active fires, most importantly in Brazil. However, these figures were never compared to the number of blazes over a longer time period, reads a watchers.news article.

Using information from ESA’s Fire CCI project, researchers studied fire-ravaged areas in South America in 2018 and 2019, then compared the data to the annual average from 2001 to 2018. The report indicated that the total burned area in South America was roughly 70 percent more in 2019 as compared to the same period of 2018– however, only a fraction more than the annual average over the previous 17 years:


Continuer la lecture de ESA STUDY REVEALS THE 2019 “HORRIFIC” AMAZON FIRE SEASON WAS ACTUALLY INLINE WITH THE 2001-2018 AVERAGE

Tendency, Convenient Mistakes, and the Importance of Physical Reasoning.

by Pat Frank, March 1, 2020 in WUWT


Last February 7, statistician Richard Booth, Ph.D. (hereinafter, Rich) posted a very long critique titled, What do you mean by “mean”: an essay on black boxes, emulators, and uncertainty” which is very critical of the GCM air temperature projection emulator in my paper. He was also very critical of the notion of predictive uncertainty itself.

This post critically assesses his criticism.

An aside before the main topic. In his critique, Rich made many of the same mistakes in physical error analysis as do climate modelers. I have described the incompetence of that guild at WUWT here and here.

Rich and climate modelers both describe the probability distribution of the output of a model of unknown physical competence and accuracy, as being identical to physical error and predictive reliability.

Their view is wrong.

Unknown physical competence and accuracy describes the current state of climate models (at least until recently. See also Anagnostopoulos, et al. (2010), Lindzen & Choi (2011), Zanchettin, et al., (2017), and Loehle, (2018)).

GCM climate hindcasts are not tests of accuracy, because GCMs are tuned to reproduce hindcast targets. For example, here, here, and here. Tests of GCMs against a past climate that they were tuned to reproduce is no indication of physical competence.

When a model is of unknown competence in physical accuracy, the statistical dispersion of its projective output cannot be a measure of physical error or of predictive reliability.

Ignorance of this problem entails the very basic scientific mistake that climate modelers evidently strongly embrace and that appears repeatedly in Rich’s essay. It reduces both contemporary climate modeling and Rich’s essay to scientific vacancy.

The correspondence of Rich’s work with that of climate modelers reiterates something I realized after much immersion in published climatology literature — that climate modeling is an exercise in statistical speculation. Papers on climate modeling are almost entirely statistical conjectures. Climate modeling plays with physical parameters but is not a branch of physics.

I believe this circumstance refutes the American Statistical Society’s statement that more statisticians should enter climatology. Climatology doesn’t need more statisticians because it already has far too many: the climate modelers who pretend at science. Consensus climatologists play at scienceness and can’t discern the difference between that and the real thing.

Climatology needs more scientists. Evidence suggests many of the good ones previously resident have been caused to flee.

La péninsule Antarctique se porte bien

by P. Berth, 28 février 2020 in ScienceClimatEnergie


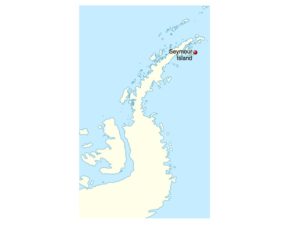
Selon un récent article du Guardian, des scientifiques ont mesuré pour la première fois la température de 20,75°C le 9 février 2020 sur l’île Seymour, une île située au large de la péninsule Antarctique. Cette île comporte la station de mesure Marambio où les relevés ont été réalisés. Bien entendu, cette nouvelle a été reprise par les médias, Greta Thunberg en tête. Cependant, en analysant objectivement la situation vous pourrez constater qu’il n’y a pas lieu de s’alarmer.

1. Localisation de l’île Seymour et température moyenne annuelle

L’île Seymour est située au large de la péninsule Antarctique (Figure 1), la région la plus au nord du continent Antarctique et, quasiment, la seule partie d’Antarctique s’étendant au-delà du cercle polaire.

3. Conclusions

– Pour comprendre ce qu’il se passe dans un jeu de données de température il ne faut pas considérer une seule mesure comme le fait l’article du Guardian; il ne faut pas non plus considérer une seule station de mesure.

– Si l’on désire faire passer des droites parmi les données de température, les plus longues séries disponibles sont celles de la station Orcadas (depuis 1902), qui est quand même assez éloignée de la péninsule Antarctique. On constate alors un réchauffement d’environ + 2°C en 110 ans (la courbe de tendance coupe –5°C en 1900 et –3°C en 2010). Cependant, en considérant des courbes polynomiales dont le coefficient de détermination est meilleur on constate que les températures moyennes chutent depuis les années 2000, comme dans toutes les stations de la péninsule Antarctique présentées dans cet article.

– Les phénomènes naturels suivent rarement des droites. Ils sont généralement cycliques, avec des périodes et amplitudes très variables. Il est donc permis de conclure que la péninsule Antarctique ne se réchauffe pas depuis 25 ans. Ceci est confirmé par d’autres analyses (voir ici et ici) et il est dommage qu’une fois de plus les médias ne fassent pas plus preuve de rigueur et se permettent des raccourcis donnant une information inexacte à 100%. En sont-ils seulement conscients ?

4 New Papers, One Alarm-Dispelling Conclusion: Future Sea Level Rise May NOT Threaten Islands After All

by K. Richard, November 4, 2019 in NoTricksZone


As reported in 4 separately-published papers, scientists have discovered a mechanism whereby islands can build themselves up naturally, thwarting the threat of sea level rise.  Tuck et al. (2019) affirm the implications of island building are profound, as it will offset existing scenarios of dramatic increases in island flooding.”

Earlier this year, Duvat (2019) identified a global trend in island shoreline net growth despite recent sea level rise.

The welcome news is that none of the islands larger than 10 ha – and just 1.2% of the 334 islands larger than 5 ha – have decreased in size since the 1980s. Nearly 90% of the world’s islands have been stable to expanding in coastal area during recent decades.

Half of 21st Century Warming Due to El Nino

by Roy Spencer, May 13, 2019 in GlobalWarming


A major uncertainty in figuring out how much of recent warming has been human-caused is knowing how much nature has caused. The IPCC is quite sure that nature is responsible for less than half of the warming since the mid-1900s, but politicians, activists, and various green energy pundits go even further, behaving as if warming is 100% human-caused.

The fact is we really don’t understand the causes of natural climate change on the time scale of an individual lifetime, although theories abound. For example, there is plenty of evidence that the Little Ice Age was real, and so some of the warming over the last 150 years (especially prior to 1940) was natural — but how much?

The answer makes as huge difference to energy policy. If global warming is only 50% as large as is predicted by the IPCC (which would make it only 20% of the problem portrayed by the media and politicians), then the immense cost of renewable energy can be avoided until we have new cost-competitive energy technologies.

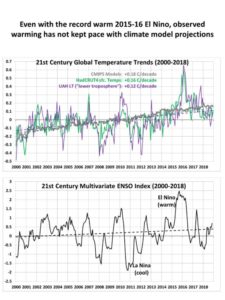
The recently published paper Recent Global Warming as Confirmed by AIRSused 15 years of infrared satellite data to obtain a rather strong global surface warming trend of +0.24 C/decade. Objections have been made to that study by me (e.g. here) and others, not the least of which is the fact that the 2003-2017 period addressed had a record warm El Nino near the end (2015-16), which means the computed warming trend over that period is not entirely human-caused warming.

If we look at the warming over the 19-year period 2000-2018, we see the record El Nino event during 2015-16 (all monthly anomalies are relative to the 2001-2017 average seasonal cycle):


Denver Weather: Another Record Broken As Temperatures Plunge To Near Zero

by Ashton Altieri, Oct 30, 2019 in 4CBSDenver


DENVER (CBS4) – The temperature in Denver officially dropped to 3 degrees above zero early Wednesday morning. It was cold enough to shatter the previous record low for October 30 by 4 degrees. It was our third record temperature in 3 days and one more record is expected Thursday morning.

One final record is expected Thursday morning when the combination of clear skies, mainly light winds, and snow on the ground allows temperatures to plunge below zero along the Front Range. If the temperature manages to drop below -2° early Thursday, the all-time record low for October in Denver will be broken.  That record was set on October 29, 1917.

World Leading Climate Scientist: “Greta’s Message Is Ridiculous”…”Something Of An End-Of-World Sect”

by Prof. H .von Storch, October 29, 2019 in NoTricksZone


In an interview with the Hamburg daily Abendblatt here, retired German climate researcher Prof. Hans von Storch commented on the global climate debate, saying “Greta’s message is ridiculous” and that “Greta Thunberg’s demand that we panic has something of an en of world sect.”

Doesn’t share doomsday views

When asked by the Abendblatt whether he shares the doomsday views of a “climate crisis” and that there needs to be an “uprising, or extinction”, von Storch says he does not share that outlook and reminded that today’s modern technology has made it possible for people to live by the millions in areas that would otherwise be inhospitable, like Phoenix, Arizona. “That was impossible in the past; today there are air conditioning systems.”

Selective listening

On Greta Thunberg’s demand that we “listen to the science!”, the award-winning German scientist slaps it down, hinting at a non-consensus among scientists: “She demands listening to scientists who should reinforce what she believes and says anyway.”

Le GIEC en est virtuellement certain…

by Prof. Dr. Jean N., 11 octobre 2019 in ScienceClimatEnergie


Le dernier rapport spécial du GIEC vient de sortir. Ce rapport, appelé SROCC (“Special Report on the Ocean and Cryosphere in a Changing Climate“), a été approuvé à la 51e session du GIEC tenue les 20 et 23 septembre 2019. Il a déjà fait beaucoup parler de lui dans les médias. Le résumé du rapport à l’intention des décideurs (SPM) a été présenté lors d’une conférence de presse le 25 septembre 2019. Pour ceux qui comprennent l’anglais, qui ont une formation scientifique et surtout qui ont le temps de lire 1170 pages, le fichier PDF de ce rapport est disponible sur le site du GIEC. Le présent article analyse le chapitre 4 de ce rapport, celui qui traite de la montée des océans. Rassurez-vous, nous n’allons pas critiquer la montée du niveau des océans qui est un phénomène bien réel. Nous allons plutôt montrer que les auteurs ont étrangement omis certaines explications qui relativisent la portée de leurs conclusions, notamment concernant la cause de la hausse du niveau marin.

1. Structure du chapitre 4

Ce chapitre 4 consiste en 168 pages et a pour titre “Élévation du niveau de la mer et conséquences pour les îles, les côtes et les communautés de faible altitude“. Les deux auteurs coordonnateurs de ce chapitre sont Michael Oppenheimer (USA) et Bruce Glavovic (Nouvelle Zélande). Les auteurs principaux sont au nombre de 13 et les auteurs contributeurs sont au nombre de 31. Au final, 46 scientifiques ont donc contribué à écrire ce chapitre. Rien que pour ce chapitre les auteurs citent un peu plus de 1500 références, essentiellement des articles scientifiques.

Qu’apprend-t-on dans le chapitre 4?

Pour faire simple, nous y apprenons : (1) Que le niveau moyen des océans monte toujours et que la vitesse s’accélère; (2) Que cette montée du niveau marin est essentiellement causée par l’homme; (3) Que l’on peut calculer ce qui va se passer dans le futur grâce aux modèles numériques; (4) Que l’on peut éventuellement se protéger de la hausse du niveau marin par toute une série de mesures.

Nous allons maintenant nous focaliser sur les points n°1 (montée du niveau) et n°2 (les causes).

2. La montée du niveau moyen des océans selon le SROCC

NEW ZEALAND EXPERIENCES FOURTH COLDEST SEPTEMBER THIS CENTURY

by Cap Allon, October 4, 2019 in Electroverse


New Zealand’s average temperature last month –for the country as a whole– was below the 1981-2010 September avg., Niwa has said in its Monthly Climate Summary.

An unusual warming of the atmosphere high above Antarctica –called a Sudden Stratospheric Warming event (SSW)– assisted in making last month the fourth coldest September in New Zealand this century.

There have only ever been two SSWs recorded in the Southern Hemisphere, previous to this years — one in September 2002 (major) and another in September 2010 (minor).

The 2002 SSW event resulted in New Zealand experiencing a significant cold outbreak in October while the 2010 event was associated with record rainfall during September.

Record Antarctic Stratospheric Warming Causes Sept. 2019 Global Temperature Update Confusion

by Roy Spencer, October 4, 2019 in WUWT


While the vast majority of our monthly global temperature updates are pretty routine, September 2019 is proving to be a unique exception. The bottom line is that there is nothing wrong with the UAH temperatures we originally reported. But what I discovered about last month is pretty unusual.

It all started when our global lower tropospheric (LT) temperature came in at an unexpectedly high +0.61 deg. C above the 1981-2010 average. I say “unexpected” because, as WeatherBell’s Joe Bastardi has pointed out, the global average surface temperature from NOAA’s CFS model had been running about 0.3 C above normal, and our numbers are usually not that different from that model product.

[By way of review, the three basic layers we compute average temperatures from the satellites are, in increasing altitude, the mid-troposphere (MT), tropopause region (TP), and lower stratosphere (LS). From these three deep layer temperatures, we compute the lower tropospheric (LT) product using a linear combination of the three main channels, LT = 1.548MT – 0.538TP +0.01LS.]

Yesterday, John Christy noticed that the Southern Hemisphere was unusually warm in our lower stratosphere (LS) temperature product, while the Northern Hemisphere was unusually cool. This led me to look at the tropical results for our mid-troposphere (MT) and ‘tropopause’ (TP) products, which in the tropics usually track each other. A scatterplot of them revealed September 2019 to be a clear outlier, that is, the TP temperature anomaly was too cool for the MT temperature anomaly.

So, John put a notice on his monthly global temperature update report, and I added a notice to the top of my monthly blog post, that we suspected maybe one of the two satellites we are currently using (NOAA-19 and Metop-B) had problems.

As it turns out, there were no problems with the data. Just an unusual regional weather event that produced an unusual global response.

Continental Cooling: Earliest Snow In 20 Years In Greta’s Sweden…Data Suggest Autumn Arriving EARLIER In Europe!

by P. Gosselin, Sep. 22, 2019 in NoTricksZone


By Kirye in Tokyo

Cooling August trends and stunningly early snows in Europe contradict global catastrophist warming claims.

Recently we heard reports of the earliest snowfall in Greta Thunberg’s Sweden in 20 years, and “stunning” snowfall in Norway. So it’s been strange to hear during these hysterical days of Fridays for Future (FFF) how snowfall is supposed to disappear even in the dead of winter.

Yet, Sweden’s and Norway’s early snowfall really should not come as a surprise when we look at the temperature trends for late summer in Sweden and elsewhere. The data are telling us that the opposite is happening: In reality autumn seems to be arriving earlier in Scandinavia.

Fall arriving sooner in Scandinavia

Using the untampered data from the Japan Meteorological Agency (JMA) from the 6 Swedish stations that offer close to complete datasets, we see that August has been seeing a late summer cooling trend across the Nordic country:

Over 170 News Outlets Vow To Spread Climate Hysteria Ahead Of UN Summit

by  J. Syemour, Sep. 2, 2019 in ClimateChangeDispatch


Objectivity and truth-telling are no longer the most “sacred” responsibilities of the news media, at least according to the far-left The Nation magazine. It’s now … climate change.

“We see Covering Climate Now as a fulfillment of journalism’s most sacred responsibilities, which are to inform people and foster constructive debate about common challenges and opportunities,” The Nation wrote on Aug. 28.

The Nation, Columbia Journalism Review (CJR) and The Guardian spearheaded The Covering Climate Now project.

On Aug. 28, they announced that 170 news outlets around the world signed on to the agenda-driven effort. They bragged that biased journalism will be delivered to a combined audience of hundreds of millions of people.

The list included a Who’s Who of liberal U.S. media outlets including Bloomberg, CBS News, PBS NewsHour, Newsweek, “eminent specialist publications” Nature, Scientific American, InsideClimate News, and “distinguished digital publications” HuffPost, Vox, The Intercept, and Slate.

Audiences can expect to be bombarded by climate alarmism the week of Sept. 16-23, since all the participating outlets agreed to focus on climate that week — just ahead of the UN Intergovernmental Panel on Climate Change summit in New York.

Although some aren’t waiting. CBS has already been celebrating the arrival of 16-year-old “climate warrior” Greta Thunberg and promoting her journey by low-emissions yacht while ignoring the fact that people have to fly to NY to retrieve the boat.

Walruses climbing cliffs and falling off them are natural events: 1994 video from Alaska

by Polar Bear Science, Sept. 2, 2019 in WUWT


Posted on September 1, 2019 | Comments Off on Walruses climbing cliffs and falling off them are natural events: 1994 video from Alaska

US Fish and Wildlife officials in 1994 explain walruses falling to their deaths from a cliff at Cape Pierce in the southern Bering Sea (a haulout for adult males during the ice-free season). Explanation? Overcrowding (too many walruses)!


Hype from the Netflix/Attenborough ‘climate change is gonna destroy the world’ fearmongers earlier this year notwithstanding – or the media this summer trying to stir up climate change fever – the US Fish and Wildlife Service determined in October 2017 that the Pacific walrus is not being harmed by climate change and is not likely to be harmed within the foreseeable future (USFWS 2017). The IUCN Red List (2015) lists the Pacific walrus as ‘data deficient‘.

Large herds onshore are a sign of population health, not climate change, and walruses have come ashore in the Chukchi Sea during the ice-free season in summer and/or fall for more than 100 years (Crockford 2014; Fischbach et al. 2016; Lowrey 1985). Those are the relevant scientific facts.