by G.K. Mitchell, Aug 19, 202 in ClimateChangeDispatch
…
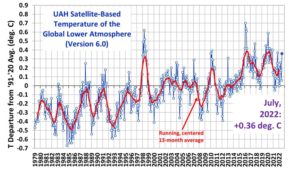
In its seminal report in 1990, the U.N. IPCC stated that “at the then current rate of world emissions of CO2, the global mean temperature would likely increase by 1°C by 2025.”
This statement formed the basis for the hypothesis that anthropogenic (man-made) global warmingresulted from the increased concentration of CO2 in the Earth’s lower atmosphere resulting from man-made activities.
Central to the hypothesis was that the temperature of the lower troposphere would increase as the concentration of CO2 in the troposphere increased.
Therefore, in its 1990 report, the U.N. IPCC established a direct linkage between the concentration of CO2 in the atmosphere and the temperature of the lower troposphere.
The scientific method of inquiry has guided scientific research and investigation for over 400 years. In summary, the scientific method requires that a researcher observe a phenomenon, postulate a hypothesis for the cause of the phenomenon, and then conduct experiments or scientific investigations to falsify the hypothesis.
In adherence to the scientific method, a climate scientist who thinks that man has caused global warming should develop a complex hypothesis as follows:
-
Global warming has occurred; that is, the temperature of the world’s oceans, landmass, and relevant atmosphere has risen during the period under investigation by a statistically significant amount.
-
Man’s activities are responsible for the global warming that has occurred.
-
The extent to which global warming has occurred, or is reasonably projected to occur in the future, will adversely affect life on Earth.
If any of the conjectures in the complex hypothesis above are found to be invalid, the complex hypothesis is determined to be falsified and either discarded or modified.
…
…