Archives de catégorie : climate-debate

Why You Should Ignore The Latest IPCC Climate Report

by R. Barmby, Mar 31, 2023 in ClimateChangheDispatch


You have a fever with jaundice, feel crappy, and are vomiting.

You go to the emergency room at the local hospital.

The ER doctor does not run any tests, but based on the symptoms his diagnosis is acute alcoholism and prescribes abstinence or you will drink yourself to death.

“What about some tests, or a second opinion?” you ask. The doctor informs you that “the administration in this hospital has two rules: firstly, the only diagnosis we give out for these symptoms is chronic alcohol abuse; and secondly, we delete any data to the contrary from your file.”

You check into rehab but the fever, jaundice, and nausea persist. Six days later you die from acute fulminant viral hepatitis (Hep B). But sober.

A reasonable person would not accept a diagnosis dictated by the hospital administration and the deletion of conflicting data. Especially if you knew acute alcoholic hepatitis and acute viral HBV hepatitis present the same symptoms and it takes blood tests to differentiate them with certainty.

And that’s why you should ignore the latest Intergovernmental Panel on Climate Change (IPCC) reportbecause two similar rules govern their analysis and reporting. The cure is also similar: Net Zero CO2 by 2050.

The IPCC Report Cycle

The IPCC’s 1988 mandate from the United Nations was to review, “The state of the knowledge of the science of climate and climatic change”.

In that mandate, the UN expressed “concern that human activities could change global climate patterns, threatening present and future generations…” and also includes the conjecture “…emerging evidence indicates that continued growth in ‘greenhouse’ gases could produce global warming…”

For the last 35 years, the IPCC has developed this mandate into an industry of perpetual reporting on a six-year cycle designed to instill constant fear of human-caused global warming.

The foundation of each reporting cycle, which in its whole is termed an Assessment Report (AR), is the report from Working Group I (WG I) as that is the physical sciences basis addressing the UN mandate.

It is then followed by a report from Working Group II (WG II) which assesses the impacts of climate change and then Working Group III (WG III) dictates what needs to be done to mitigate the damages caused by climate change.

Each of these reports consists of between two thousand to three thousand pages, and each is condensed into a Summary for Policy Makers (SPM). Ultimately a Synthesis Report combining all three Working Groups is issued, again with its SPM.

Media Regurgitate Nonsense About Greenland Ice Sheet And Sea Level Rise

by D. Burton, Apr 3, 2023 in ClimateChangeDispatch


CNBC and the Potsdam Institute (PIK) report that:

We’re halfway to a tipping point that would trigger 6 feet of sea-level rise from the melting of the Greenland Ice Sheet

PUBLISHED WED, MAR 29 202312:12 PM EDT By Catherine Clifford

KEY POINTS:

● Once people have cumulatively emitted approximately 1,000 gigatons of carbon in total, then the southern part of the Greenland Ice Sheet will melt eventually causing the sea level to rise by almost six feet.

● Once humans have cumulatively emitted approximately 2,500 gigatons of carbon in total, the whole Greenland Ice Sheet will eventually melt and the sea level rise would rise by 6.9 meters or 22.6 feet.


● And right now, now we are at approximately 500 gigatons of carbon emissions released.

Here’s the article.

Here’s the paper.

Like most things from PIK, this “study,” and this CNBC article, are nonsense. [emphasis, links added]

The best estimates are that since 1850, anthropogenic carbon emissions have totaled about 675 Gt of carbon (a/k/a PgC) (not 500).

Over that same period, the amount of CO2 in the atmosphere has increased by only about 135 ppmv CO2 = 287 PgC (gigatonnes carbon).

The difference is the amount removed from the atmosphere by natural negative feedbacks, such as absorption by the oceans, the greening of the Earth, and rock weathering.

(Aside: Petagram ≡ gigatonne ≡ Gt, and “PgC” means “petagram of carbon,” so 1 PgC = 1 Gt of carbon (GtC). 1 ppmv CO2 = 7.8024 Gt CO2 = 2.12940 PgC.)

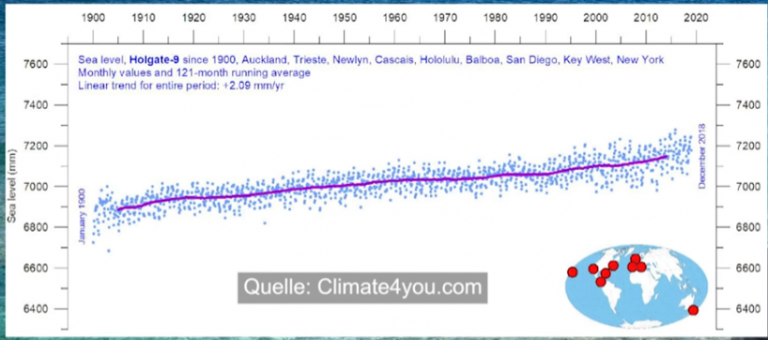
Yet we’ve only gotten an estimated 1.02 to 1.27 °C of warming from all that CO2, and it’s beenaccompanied by negligible acceleration in sea-level trends:

….

Greenland Temperatures 2020

by P. Homewood, June 12, 2021 in NotaLotofPeopleKnowThat


I mentioned a year ago that the reason for the deficit in ice mass increase during the winter and spring of 2020 was sustained cold and dry weather. (Conversely milder weather tends to bring snow). I also reported how the summer melt began much later than normal.

The Danish Meteorological Institute (DMI) have now published the official Greenland temperature for last year, bearing this out and showing how cold it really was:


image

Greenland Surface Mass Ice Balance 2019/20

http://polarportal.dk/en/greenland/surface-conditions/

New Study: Sea Levels Have Receded Over Last 1500 Years, Including Since 1800s, Along India’s Coasts

by K. Richard, April 3, 2023 in NoTricksZone


Contrary to alarmist claims, the seas have been retreating and the coasts have been expanding seaward along the coasts of southern India since the early 1800s.

Korkai was a port city, capital, and the principal trade center for India’s Pandya Kingdom from the 6th to 9th centuries CE.

While Korkai was situated on the sea coast during the early stages of the Medieval  Warm Period, the city center is now approximately 5 or 6 km from the coast. This confirms the sea has substantially receded since then.

Nautical maps from the 1805-1828 period clearly affirm the coast of southern India has continued expanding seaward in the last 200 years, despite the reported rise in relative sea level (Gupta and Bhoolokam Rajani, 2023).

In other words, much more coastal land area is above sea level today than during the Little Ice Age, or when CO2 levels were said to be 280 ppm.

Real-World Observation: Increasing CO2 By 7,000 ppm Has A 0.3°C Temperature Differential

by K. Richard, Mar 30, 2023 in NoTricksZone


Surface air CO2 concentrations vary by 100s to 1,000s of ppm within a span of hours to days or weeks across the natural world. The observational evidence suggests these variations are neither driving or even causing temperature changes.

According to recent field research (Mungai, 2021) conducted in Kenya, the observed CO2 concentrations in the atmospheric air above mofette springs (8) averages 3,400-4,800 ppm. Interestingly, the temperatures associated with these high CO2 levels are “relatively low” or “cold” (~21.5 to 29.5°C) compared to ambient temperatures at other nearby sites with ~400 ppm CO2.
 
The study also shows that when CO2 increases from 5,253 ppm in wet season to 12,138 ppm in dry season over a mofette springs site, there is only a 0.3°C temperature differential (23.4°C vs. 23.1°C) associated with this >7,000 ppm CO2 change. The sensitivity of the surface air temperature to these extremely high CO2 variations would appear to be vanishingly small – or non-existent.

The Latest UN Climate Report Is Bumper-Sticker Climate Science

by J. Curry, Mar 29, 2023 in ClimateChangeDispatch


The Intergovernmental Panel on Climate Change (IPCC) has issued a new Synthesis Report, with fanfare from the UN Secretary-General Antonio Guterres:

“The climate time-bomb is ticking but the latest IPCC report shows that we have the knowledge & resources to tackle the climate crisis. We need to act now to ensure a livable planet in the future.”

The new IPCC Report is a synthesis of the three reports that constitute the Sixth Assessment Report, plus three special reports[emphasis, links added]

This Synthesis Report does not introduceany new information or findings.

While the IPCC Reports include some good material, the Summary for Policy Makers for the Synthesis Report weakly emphasizes justified findings on climate impacts driven by extreme emission scenarios and politicized policy recommendations on emissions reductions.

The most important finding of the past five years is that the extreme emissions scenarios RCP8.5 and SSP5-8.5, commonly referred to as “business-as-usual” scenarios, are now widely recognized as implausible.

These extreme scenarios have been dropped by the UN Conference of the Parties (COP) to the UN Climate Agreement.

However, the new Synthesis Report continues to emphasize these extreme scenarios, while this important finding is buried in a footnote:

“Very high emission scenarios have become less likely but cannot be ruled out.”

The extreme emissions scenarios are associated with alarming projections of 4-5°C of warming by 2100.

The most recent Conference of the Parties (COP27) is working from a baseline temperature projectionbased on a medium emissions scenario of 2.5°C by 2100.

Climate Expert: The Misinformation In The IPCC, Part 1

by R. Pielke, Mar 29 2023 in ClimateChangeDispatch


Today, in the first of two posts, I explain how the IPCC made several misleading claims related to tropical cyclones.

The IPCC’s failures are both obvious and undeniable.

I will walk you through them in detail. Once again, I conclude that the IPCC needs reform. Mistakes can creep into massive assessments, to be sure, but the failures I document below are unacceptable. [emphasis, links added]

The first failure never rose above the depths of Chapter 11 of its AR6 Working Group 1 (WG1) report. The second is a bit technical and is much more significant – having made its way into the Summaries for Policymakers (SPMs) of both WG1 and the Synthesis Report released last week.

Before proceeding, let me reiterate that the IPCC is not just one report or one group of people. It is many things and comprised of many different people. Its products are of uneven quality, and even individual chapters in the same report can be of very different scientific quality.

For instance, in general, IPCC AR6 WG1 did a nice job on the physical science aspects of extreme weather, whereas IPCC AR6 WG2 was chock full of massive problems. …snip…

UGLY: Climate Skeptic Group Gets EVICTED from National Science Teaching Association Convention

by A. Watt, Mar 27, 2023 in WUWT


From the You can’t handle the truth! department comes this sad but predictable tale of closed minded pettiness. NSTA, is your position so strong and unassailable that you have to trample free speech rights to protect teachers from hearing alternate views? Does cancel culture now extend to the minds of educators?

From Greg Wrightstone, president of the CO2 Coalition who reports they were evicted from their paid and agreed to exhibit just minutes after the show opened. This picture shows them on their way out the door while the show is in progress.

He writes:

We had an exhibit booth and were attending the NSTA convention, but they were having none of it. We were thrown out of the NSTA annual convention yesterday for exposing their position on the teaching of climate change. Our science was not on the “Approved List” by them.


Overview of the Spectral Coherence between Planetary Resonances and Solar and Climate Oscillations

by Scafetta N. & Bianchini A., Mer 25, 2023 in MDPIClimate


Abstract

The complex dynamics of solar activity appear to be characterized by a number of oscillations ranging from monthly to multimillennial timescales, the most well-known of which being the 11-year Schwabe sunspot cycle. Solar oscillations are important because they also characterize the oscillations observed in Earth’s climate and can thus be used to explain and forecast climate changes. Thus, it is important to investigate the physical origin of solar oscillations. There appear to be two possibilities: either the oscillations in solar activity are exclusively controlled by internal solar dynamo mechanisms, or the solar dynamo is partially synchronized to planetary frequencies by planetary forcings. The latter concept has recently gained support from a growing amount of evidence. In this work, we provide an overview of the many empirical facts that would support a planetary hypothesis of the variability of solar activity and emphasize their importance for climate research. We show that the frequencies produced by the complex interactions of all of the planets are coherent with the major solar activity and climate cycles, from monthly to multimillennial timescales, including the well-known Schwabe 11-year solar cycle. We provide some persuasive theoretical and empirical support for the planetary hypothesis of solar and climate variability.

Emissions and CO2 Concentration: An Evidence Based Approach

by J. Dangler & J. Reid, Mar 25, 2023 in WUWT


A new way of looking at the the atmospheric carbon budget.

Climate science is usually concerned about the question “How much CO2 remains in the atmosphere?”, given the anthropogenic emissions and the limited capability of oceans and biosphere to absorb the surplus CO2 concentration. This has led to conclusions of the kind that a certain increasing part of anthropogenic emissions will remain in the atmosphere forever. The frequently used notion of “airborne fraction”, which is the part of anthropogenic emissions remaining in the atmosphere, seems to suggest this.

Assuming the unlikely worst case that CO2 concentration is fully responsible for all global temperature changes, the maximum expected rise of global temperature caused by the expected CO2 concentration rise is 0.4 _C from now or 1.4°C from the beginning of industrialisation.

The 1.5 C Temperature Fiction, Already Exceeded

by J. Marohasy, Mar 21, 2023 in WUWT


From Jennifer Marohasy’s blog

March 21, 2023 By jennifer

It is all over the news, another climate change report from the IPCC – the United Nation’s Intergovernmental Panel on Climate Change. Of course, it tells us that the end is nigh unless we do something to prevent temperatures exceeding 1.5 degrees Celsius. Meanwhile, not one of the contributors has any proven capacity to accurately forecast the weather more than a few days in advance, nor much of an idea of the quality of the temperature data inputted into the simulation models claiming the Earth is burning up. Yet they claim to be able to forecast temperatures years in advance and repeat over and over the value of 1.5 C as representing a tipping point.

The reality is that annual maximum temperatures across Australia were mostly falling, and by much more than 1.5 C, from at least 1910 to 1960 and then increasing, and by more than 1.5 C, since 1960.

There are few locations across Australia where temperatures have been recorded at the one place and using standard equipment (including in a Stevenson screen with a mercury thermometer) much before 1908. Darwin in the Northern Territory and Richmond in Queensland are special because they have long and relatively reliable temperature records. Making a single adjustment to the Darwin temperature record to correct for the move from the post office to the airport (after the post office was bombed in WW II), it is evident from the chart that both temperature series show cooling and then warming over the last century and by much more than 1.5 C over periods of less than a decade.

Media Regurgitates IPCC’s ‘Final Warning’ on Climate Change – Without Realizing We’ve Already Passed 1.5°C

by A. Watts, Mar 25, 2023 in WUWT


Originally posted at ClimateREALISM

The Intergovernmental Panel on Climate Change (IPCC) published the final part of its sixth assessment report (AR6) on Monday, March 20. Predictably, the media rushed to repeat the claims made in the report with their own scary, woefully overwrought, headlines. Here is a sample: The Washington Post – World is on brink of catastrophic warming, U.N. climate change report says; NBC News – Now or never: One of the biggest climate reports ever shows time is running outThe Guardian – Scientists deliver ‘final warning’ on climate crisis: act now or it’s too late; and finally Inside Climate News, with inarguably the worst headline New IPCC Report Shows the ‘Climate Time Bomb Is Ticking,’ Says UN Secretary General António Guterres.

Each of mainstream media outlets predict that “climate doom” is just around the corner, and they’re all wrong.

The reason? The newest IPCC report laments the fact that Earth will soon pass the 1.5°C level of temperature rise, seen in the projection in Figure 1. The current extrapolation is to reach 1.5°C by April 2035.


Based on that projection, the IPCC and the media predict very bad things will happen if we don’t “act now before it’s too late.” The most recent report in the AR6 series contains no new information, rather it reiterates the warnings made the physical science portion of the report issued in the summer of 2021, which also mentioned approaching 1.5°C.

Interestingly, the “before it’s too late” language has been used since 2005, when worry about just 1°C was the big doomsday news:

NASA scientist Jim Hansen introduced the “too late” language about climate change in 2005, arguing that “We have to stabilize emissions of carbon dioxide within a decade, or temperatures will warm by more than one degree [C]… we don’t have much time left”.

We heard the same type of language in 2007, when the IPCC released their Fourth Assessment Report. The headlines in The Guardian said “time is running out” and warming “could be irreversible.

The IPCC’s Dangerous Dance With Climate Misinformation And Political Demands

by R. Pielke Jr., Mar 23, 2023 in ClimateChangeDispatch


The Intergovernmental Panel on Climate Change (IPCC) is an important institution. I have often said that if it did not exist, it would have to be invented. The IPCC is often referred to as a model for how to do a scientific assessment.

Consequently, we should have the highest standards for evaluating its work, not least because climate change is important, and effective mitigation and adaptation policies are essential. [emphasis, links added]

Below I share a brief few critiques of the culminating report of the current IPCC cycle, called the Synthesis Report. The new report covers six IPCC reports published over the past nine years.

Before proceeding, it is crucial to understand that the IPCC is not a single entity or group of people. It is many different groups doing many different things, with many strengths — for instance, WG1 on extremes was particularly good.

The IPCC also has some notable weaknesses — its reliance on out-of-date scenarios most obviously. The Synthesis Report was written by a small group of people.

For better or worse, the work of this small group of people reflects upon the entire IPCC and the years of effort leading to this week’s report.

If I were an IPCC participant not involved with the Synthesis Report, I’d be pretty upset. My view is that the IPCC has strayed far from its role to assess the scientific literature in support of policymaking.

It has increasingly taken on a stance of explicit political advocacy and as it does so it has ignored and even misrepresented relevant science.

The IPCC needs a complete overhaul.

Below are some more detailed thoughts on the Synthesis Report.

Scientific Assessment Minus the Science

The Global Warming Doomsday Religion Is A Suicide Pact To Wreck Our Economy

by W. Crockett, Mar 14, 2023 in ClimateChangeDispatch


There is no scientific evidence that the minuscule 0.01% increase in atmospheric carbon dioxide (CO2) since 1780 has had any effect on the Earth’s average temperature.

Nonetheless, in the 1980s, a religious/political movement against man-made or anthropogenic CO2 arose.

It was driven by catastrophic predictions from a gaggle of impenetrable and undecipherable computer climate models operated by the International Panel on Climate Change (IPCC) and quickly metastasized into a worldwide mass movement with all the fervor of a new evangelical religion.

Composition of the Atmosphere: The tropospheric atmosphere is composed of 78% nitrogen, 21% oxygen, 1% argon, 0.4 to 4% water vapor, and several trace gases.

The largest trace gas is carbon dioxide at 0.041%, followed by methane at 0.0018%, and nitrous oxide at 0.0003%. The volume of atmospheric molecules is also expressed in terms of parts per million (ppm): nitrogen 780,000 ppm, oxygen 210,000 ppm, and argon 10,000 ppm.

Scientists have also speculated that water vapor constitutes something between 4,000 and 40,000 ppm, depending on time and location. By contrast, the trace gas CO2 has only 410 molecules per million (.041%); methane (CH4) has only a minuscule 1.8 molecules per million; and nitrous oxide (N2O) is only a barely detectable 1/3 molecule per million.

All atmospheric molecules create a blanket of heat that slows the loss of infrared radiation to space. The sun’s short-wave radiation passes through the troposphere generally unimpeded by nitrogen, oxygen, and argon molecules to the surface, which increases the kinetic motion (heat) of all impacted surface and atmospheric molecules.1

The increased molecular motion, in turn, increases full spectrum (blackbody) infrared radiation (IR) in all directions. All atmospheric molecules, including water vapor and CO2, take up the additional heat by conduction (contact), from both the surface and surrounding atmospheric molecules.

A Primer On The IPCC’s Implausible Climate Scenarios

by R. Pielke, Mar 17, 2023 in ClimateChangeDispatch


Next Monday the Intergovernmental Panel on Climate Change will release its so-called “Synthesis Report” which will integrate the findings of six different reports that it has released since 2014.

I have not participated in the IPCC nor have I seen the new report.

However, I have little doubt that one of the main issues that we will be discussing next week when the report is released will be the implausible climate scenarios that underpin much of the work of the IPCC over the past 9 years.[emphasis, links added]

Research I’ve been involved in — along with colleagues Matthew Burgess and Justin Ritchie — shows that theemissions scenarios that have guided the work of the IPCC and the broader climate research community are widely off the mark.

In short, they are far too extreme, both in what they project for today and especially into the future.

Our work is part of a growing consensus in the literature about the implausibility of extreme climate scenarios — a consensus so strong that it was acknowledged in the most recent IPCC assessmentreports, even though it complicated their messages.

The ubiquity of out-of-date scenarios throughout recent IPCC reports and the underlying literature that is has assessed means that the IPCC Synthesis Report, summarizing its work since 2014, runs the risk of promoting out-of-date science.

Rainfall, Cyclone Data Show No Clear Upward Trend, Contradict IPCC Claims

by P. Gosselin, Mar 19, 2023, in NoTricksZone


Feel helpless when trying to assess the veracity of “climate doom is looming” claims? Don’t give up trying to understand the relevant basics because you don’t need to be a scientist to do so.

There is a rather simple way to get an idea about what this is all about. Even without a scientific background, most people have at least a good common sense. And that’s all it takes to get a grasp of how energy flows back and forth between earth’s surface and the skies.

Today in Part 5, we look at the linkage between the allegedly CO2-driven rise of air and sea surface temperatures on the one side and the disconnect between these increases and their strangely weak to insignificant impact on rainfall and hurricane intensity”.

Preceding chapters see Part 1 1), Part 2 2), Part 3 3), Part 4 4).

Variability of cloud effects vs “greenhouse gas” effects

In the last chapter, we have seen that there are some discrepancies between the global warming trend as claimed by the official climate science and the local evolution of rainfall, which should be a direct consequence of higher temperatures since this causes more evaporation. This seems not to be the case e.g. for Germany, see Fig. 1:

Intense, Long-Lasting Heatwaves Unfolding At The Bottom Of The Ocean

by G. Dickie, Mar 16, 2023 in ClimateChangDispatch


Heatwaves unfolding on the bottom of the ocean can be more intense and last longer than those on the sea surface, new research suggests, but such extremes in the deep ocean are often overlooked.

A team of scientists with the U.S. National Oceanic and Atmospheric Administration has conducted the first assessment of marine heatwaves along North America’s continental shelves.

They found that these bottom heatwaves ranged from 0.5 degrees Celsius to 3C warmer than normal temperatures and could last more than six months — much longer than heatwaves at the surface.

“We simply don’t have a ton of instruments on the ocean bottom along continental shelves,” said study co-author Dillon Amaya, an NOAA climate scientist. “The ocean is a powerful thing. It destroys instruments that we have in the water for too long.

Surface heatwaves can be picked up by satellites and can result in huge algal blooms.

Claim: A Majority of Voters believe Climate Change is a False Religion

by E. Worrall, Mar 15, 2023 in WUWT


But just maybe the tide is turning.

A lot of things have been going wrong for wind and solar fanatics lately. Biden, arguably the President with the greatest record of subsidizing unreliable wind and solar in America’s history, had his chance to bring down energy prices with his solar panels and wind turbines. Instead, he delivered the spectacle of the US Secretary of State crawling to the Saudis, begging for access to their oil, oil which could have been delivered by the Keystone Pipeline and other petroleum projects the Biden administration sabotaged.

In Britain and Germany – energy prices. Chancellor Olaf Scholz of Germany has implausibly promised an energy miracle, but Britain and Europe have already waited a long time for the promised reward for all the hardship they have endured and the trillion Pounds and Euros spent over the last few decades.

The measures Britain and Germany have taken to avert catastrophe in the face of Russian gas supply disruption, and the utter failure of  the climate alarmist’s energy programmes to deliver, are beyond embarrassing. Germany is bulldozing villagesold growth forests, even a wind farm to dig up coal to avoid further deindustrialization caused by their maniacal reliance on intermittent wind and solar. Britain deferred decommissioning her decrepit coal plants. Just as well, Britain needed those coal plants again just last week.

In Australia, Prime Minister Albanese, who won on the promise of a substantial drop in energy prices, well that promise is now looking pretty shaky. Household energy prices are set to rise 20%, 30% next year?Who knows. What we do know, is it will be a lot – and the dirt cheap coal power which bring down prices is scheduled to be shut down.

With the promises of the climate religion wearing thin, and climate concern faltering in the face of mortgage stress and soaring energy bills, perhaps this Rasmussen poll is what it appears to be – an early indication of a sea change in public opinion concerning climate change and climate action.

The Global Warming Doomsday Religion Is A Suicide Pact To Wreck Our Economy

by D.W. Crockett, Mar 14, 2023 in ClimateChangeDispatch


There is no scientific evidence that the minuscule 0.01% increase in atmospheric carbon dioxide (CO2) since 1780 has had any effect on the Earth’s average temperature.

Nonetheless, in the 1980s, a religious/political movement against man-made or anthropogenic CO2 arose.

It was driven by catastrophic predictions from a gaggle of impenetrable and undecipherable computer climate models operated by the International Panel on Climate Change (IPCC) and quickly metastasized into a worldwide mass movement with all the fervor of a new evangelical religion.

As Eric Hoffer observes in his book, The True Believer, “Mass movements can rise and spread without belief in God, but never without belief in a devil.”

In this new “doomsday” mass movement, millions of people truly believe that man-made CO2 is a modern-day devil that will cause glaciers to melt, seas to rise, and coastlines to submerge. They also believe that mankind can, and must, save the planet from this catastrophe by reducing emissions of the devil CO2 to net zero.

Those who don’t believe are labeled “climate deniers,” a derogatory reference to those who deny that the Nazis perpetrated the Holocaust.

Unfortunately, most politicians in the U.S., Canada, and Europe, as well as the press and heads of many large corporations have blindly joined this Anthropogenic Global Warming (AGW) religion to stamp out the CO2 devil.

..

….

CMIP6 GCM Validation Based on ECS and TCR Ranking for 21st Century Temperature Projections and Risk Assessment

by N. Scafetta, Feb 9, 2023 in MDPI_Atmosphere


Abstract

Global climate models (GCMs) from the sixth Coupled Model Intercomparison Project Phases (CMIP6) have been employed to simulate the twenty-first-century temperatures for the risk assessment of future climate change. However, their transient climate response (TCR) ranges from 1.2 to 2.8 °C, whereas their equilibrium climate sensitivity (ECS) ranges from 1.8 to 5.7 °C, leading to large variations in the climatic impact of an anthropogenic increase in atmospheric CO2 levels. Moreover, there is growing evidence that many GCMs are running “too hot” and are hence unreliable for directing policies for future climate changes. Here, I rank 41 CMIP6 GCMs according to how successfully they hindcast the global surface warming between 1980 and 2021 using both their published ECS and TCR estimates. The sub-ensemble of GCMs with the best performance appears to be composed of the models with ECS ranging between 1.8 and 3.0 °C (which confirms previous studies) and TCR ranging between 1.2 and 1.8 °C. This GCM sub-ensemble is made up of a total of 17 models. Depending on the emission scenarios, these GCMs predict a 2045–2055 warming of 1.5–2.5 °C compared to the pre-industrial era (1850–1900). As a result, the global aggregated impact and risk estimates seem to be moderate, which implies that any negative effects of future climate change may be adequately addressed by adaptation programs. However, there are also doubts regarding the actual magnitude of global warming, which might be exaggerated because of urban heat contamination and other local non-climatic biases. A final section is dedicated to highlighting the divergences observed between the global surface temperature records and a number of alternative temperature reconstructions from lower troposphere satellite measurements, tree-ring-width chronologies, and surface temperature records based on rural stations alone. If the global warming reported by the climate records is overestimated, the real ECS and TCR may be significantly lower than what is produced by the CMIP6 GCMs, as some independent studies have already suggested, which would invalidate all of the CMIP6 GCMs.

Met Office accused of implausible worst-case climate prediction

by P. Homewood, Mar 9, 2023 in NotaLotofPeopleKnowThat


The Met Office claims are derived from computer modelling based on the so-called RCP8.5 emissions scenario, the most extreme pathway for global greenhouse gas emissions, which the Met Office misleadingly describes as “plausible”.


In reality, most credible scientists regard RCP8.5 as implausible given that global emissions data and technological advances essentially rule it out. As a result, the Biden Administration has abandoned using this discredited worst-case scenario.
Moreover, the Met Office offers no empirical data in evidence that an increased trend in extreme rainfall events has actually been observed in line with their modelling. In fact some studies suggest the opposite may have occurred in recent decades.


Dr Benny Peiser, the director of the Global Warming Policy Foundation, called on the Met Office to withdraw its fatally flawed study:
“The Met Office should withdraw this grossly misleading and baseless study which is undermining its scientific credibility and integrity and makes it look incompetent.”


Additional information about RCP8.5  


* Roger Pilke Jr.: The Biden Administration Abandons RCP8.5
* Anders Bolling: This is how the UN’s worst scenario was normalized and distorted our view of global warming
* Tim Worstall: A Saviour Spurned: How fracking saved us from global warming (pdf)

Recent Shoreline Changes To Pacific Islands ‘Dwarfed’ By Change Magnitudes Of The Past

by K. Richard, Mar 6, 2023 in NoTricksZone

Most of the 1100 Pacific and Indian Ocean islands have been growing, not shrinking in size, in the last half century.

Activists convinced humans are able to exert fundamental control over ocean dynamics claim the rates of sea level rise and modern climate change are so rapid and unprecedented that modern changes are dramatically affecting shoreline movement on low-lying islands.

But a new study (Kench et al., 2023) assesses the opposite may be true. Recent shoreline changes (±40 m/50 years) are “dwarfed” by the shoreline changes (±200 m/100 years) that occurred throughout previous centuries. Globally, here is nothing “unprecedented” about what has been occurring with reef island shoreline dynamics in recent decades.

Of the global database of 1,100 Pacific and Indian Ocean reef islands, the “dominant mode of response has been the expansion of islands on reef surfaces (>53%)” over the last half-century. Only 0.3% (3 of 1,100) of islands have experienced “total loss.” Similarly, Duvat (2019) found 89% of 709 global-scale islands have been either stable or growing in size since the 1980s.

Of the islands sampled for the study, none are older than 1,400 years. Before then, they were submerged beneath the sea due to the much higher sea levels of the past.

Science Yields Surprises! Island Nations Growing… “Atoll, Island Stability Is Global Trend”!

by P. Gosselin, Mar 8, 2023 in WUWT


IPCC high-end sea level predictions for 2100 are “highly erroneous”. 

Global warming alarmists like to claim that Pacific island nations are on the verge of disappearing – due to rising sea levels caused by polar ice melting due to global warming, which in turn supposedly is caused by rising concentrations of “heat-trapping” trace gas CO2 from the burning of fossil fuels.

These coral reef island nations risk going under real soon, unless we wean ourselves from fossil fuels soon, they say.

Coral reef island nations are emerging, not disappearing

But yesterday Kenneth here presented a new paper appearing in Nature, (Kench et al., 2023), which looks at whether the coral reef islands are in fact seeing unprecedented and undergoing accelerating physical changes that risk outrunning human adaptation measures. The authors analyzed the dynamics of a Maldivian reef island at millennial to decadal timescales.

Recent changes not unprecedented

The researchers found that “island change over the past half-century (±40 m movement) is not unprecedented compared with paleo-dynamic evidence”.

Nothing unusual is happening. The global data suggest that almost all islands are in fact growing, and not  disappearing under water like climate alarmists mistakenly believe.

“Recent shoreline changes (±40 m/50 years) are ‘dwarfed’ by the shoreline changes (±200 m/100 years) that occurred throughout previous centuries,” the study’s authors write.

 89% of all the globe’s islands are stable, or growing!

Moreover, just 4 years ago, another peer-reviewed publication appearing in a renowned journal found similar results: 89% of the globe’s islands and 100% of large islands have stable or growing coasts! According to Duvat, 2019:

“88.6% of islands were either stable or increased in area, while only 11.4% contracted. It is noteworthy that no island larger than 10 ha decreased in size. These results show that atoll and island areal stability is a global trend, whatever the rate of sea-level rise.”

Moreover, Khan et al (2018) found: “Prediction of 4–6.6 ft sea level rise in the next 91 years between 2009 and 2100 is highly erroneous.”