Climate of the Past, Present and Future. A scientific debate, 2nd ed.

by J. Vinos, Sep 2022 in ResearchGate


Abstract
This book is an unorthodox ground-breaking scientific study on natural climate change and its contribution to ongoing multi-centennial global warming. The book critically reviews the effect of the following on climate: – Milankovitch cycles – abrupt glacial (Dansgaard-Oeschger) events – Holocene climate variability – the 1500-year cycle – solar activity – volcanic eruptions – greenhouse gases – energy transport Applying the scientific method to available evidence reveals that some of these phenomena are profoundly misunderstood by most researchers. Milankovitch cycles are tied to orbital obliquity, not to orbital precessional summer insolation; glacial megatides might have triggered abrupt Dansgaard-Oeschger events; and tides are likely responsible for the related 1500-year climate cycle. Climate change affects volcanic eruptions more than the opposite; and secular variations in solar activity are more important to climate change during the Holocene than greenhouse gases. In this book, we see how important natural climate change has been on human societies of the past. It also produces new climate projections for the 21st century and when the next glaciation could happen. What emerges from this study of natural climate change is a central theme: Variations in the transport of energy from the tropics to the poles have been neglected as a cause of climate change, and solar activity variations affect climate by modulating this transport. The author tells us: –Transporting more energy from a greenhouse gas-rich region, the tropics, to a greenhouse gas-poor region, the poles, increases the amount of energy lost at the top of the atmosphere. The effect resembles a reduction in the greenhouse gas content.– The book presents the Winter-Gatekeeper Hypothesis on how variations in solar activity regulate Earth’s energy transport and in so doing affect atmospheric circulation, the rotation of the planet, and the El Niño/Southern Oscillation. This book is oriented toward students and academics in the climate sciences and climate anthropology and should also appeal to readers interested in the science of natural climate change. The repercussions of Climate of the Past, Present and Future are far reaching. By uncovering a strong natural climate change component, it provides a novel view of anthropogenic climate change, fossil energy use, and our future climate; a view quite different from the IPCC’s gloomy projections.

Three More New Temperature Reconstructions Document A Warmer Medieval Period

by K. Richard, Apr 11, 2024 in NoTricksZone


he North Atlantic, the Pacific Northwest (USA), and northern Finland were all warmer than today between 1000 and 2000 years ago.

Today’s (2000 CE) July air temperatures in the Azores – archipelago islands in the middle North Atlantic, ~1400 km west of Portugal – are visually shown to average about 10 to 11°C in a newly published reconstruction (Raposeiro et al., 2024).

This average air temperature is about 1 to 2°C warmer than this location’s Little Ice Age climate, or the coldest period (~9.1°C from 1750-1800) of the last 2000 years. However, the Medieval Climate Anomaly (MCA) had temperatures reaching into the 13-15°C range, which is 3-4°C warmer than modern.


A temperature reconstruction from a lake in the USA’s Pacific Northwest (Baig, 2024) indicates glacial temperatures were only 1.0 to 1.6°C colder than the modern temperature, 12.2°C. Temperatures reached 13.7°C, or 1.5°C warmer than today, ~2500 years ago, and then fluctuated between 12.6 and 12.2°C from 1900 years ago until today, a period encompassing both the Medieval Warm Period and Little Ice Age.

Another lake sediment temperature reconstruction using branched glycerol dialkyl glycerol tetraethers (brGDGTs) from northern Finland (Otiniano et al., 2024) suggests the modern temperature (represented as the blue diamond) is among the coldest of the last ~8000 years. Temperatures were much warmer than modern about 1200 to 1500 years ago, and throughout the period from 7000 to 3000 years ago.

The Anthropocene is not an official stratigraphic unit

by A. Préat and B. Van Vliet-Lanoë, Apr 12,2024 in SCE


Main theme: Ever since the idea of a new geological unit, the Anthropocene, waslaunched in 2000 by Paul Crutzen, an atmospheric chemist and Nobel Prize winner, the scientific community has been inflamed by the current global warming situation, and passionate debates have raged between those in favor of this new anthropogenic unit and those opposed to it. The discussion has spread well beyond the geological community, yet it is geologists, and geologists alone, who are able to formally define geological units, in this case stratigraphic units. Our article will reviewthe rules of stratigraphy and show that the introduction of the Anthropocene as a stratigraphic unit does not comply with these rules. After 15 years of debate, the ICS (International Commission on Stratigraphy) has just officially rejected the Anthropocene as a stratigraphic unit. In conclusion, the Anthropocene must be
considered as a ‘Geo-ethical’ unit and not as a ‘Geological’ unit.

Example of the GSSP stratotype from the Thanetian geological stage (Paleocene, see Figure 1). Note the golden spike (see text below). Photography : Pierre Thomas.

UAH Global Temperature Update for March, 2024: +0.95 deg. C

by R. Spencer, Apr 2, 2024 in WUWT


The Version 6 global average lower tropospheric temperature (LT) anomaly for March, 2024 was +0.95 deg. C departure from the 1991-2020 mean, up slightly from the February, 2024 anomaly of +0.93 deg. C, and setting a new high monthly anomaly record for the 1979-2024 satellite period.

New high temperature records were also set for the Southern Hemisphere (+0.88 deg. C, exceeding +0.86 deg. C in September, 2023) and the tropics (+1.34 deg. C, exceeding +1.27 deg. C in January, 2024). We are likely seeing the last of the El Nino excess warmth of the upper tropical ocean being transferred to the troposphere.


The extraordinary climate events of 2022-24

by J. Vinos, March 24, 2024 in ClimateEtc


The unlikely volcano, the warmest year, and the collapse of the polar vortex.

The climate events of 2022-24 have been were truly extraordinary. From an unlikely undersea volcanic eruption to the warmest year on record to the collapse of the polar vortex after three sudden stratospheric warming events. This rare convergence presents a unique learning opportunity for climatologists and climate aficionados alike, offering insights into a climate event that may not be repeated for hundreds or even thousands of years.

  1. January 2022, the unlikely volcano

Never before have we witnessed an undersea volcanic eruption with a plume capable of reaching the stratosphere and depositing a large amount of vaporized water. This extraordinary event occurred in January 2022 when the Hunga Tonga volcano erupted. The conditions for such an event are rare: the volcano must be deep enough to propel enough water with the plume, but not too deep to prevent it from reaching the stratosphere. Most undersea volcanoes do not produce plumes at all, which makes Hunga Tonga’s eruption all the more remarkable.

The Hunga Tonga volcano occupied a unique “sweet spot” at a depth of 150 meters the day before the eruption. In addition, the eruption itself must be exceptionally powerful for water vapor to rise into the stratosphere. The January 2022 eruption of Hunga Tonga was the most powerful in 30 years, since the 1991 eruption of Mt. Pinatubo.

Figure 1. The Hunga Tonga eruption from space.

  1. 2023, the hottest year on record

Beginning in June 2023, the last seven months of the year marked the warmest period on record, significantly exceeding previous records. Such an event is quite remarkable, given the considerable temperature variability observed from month to month. But how unlikely is it?

  1. January-March 2024, the collapse of the polar vortex

The polar vortex is a circular wind pattern that develops on rotating planets with an atmosphere. It results from the conservation of potential vorticity, a property depending on the Coriolis force and the potential temperature gradient. The potential temperature refers to the portion of the temperature of an air parcel that is not affected by its potential energy, and is often defined as the temperature the parcel would have if it were brought to the surface (1,000 hPa).

  1. What can we expect in the near future?

The unlikely volcanic eruption is the likely cause of the extraordinary warming, which in turn led to the occurrence of the unprecedented three SSW events. Our understanding of the effects of these events supports this interpretation.

3 New Studies Confirm Sea Levels Were 5 to 9 Meters Higher 7,000-5,000 Years Ago Than Today

by K. Richard,  Apr 1, 2024 in ClimateChangeDispatch


Modern relative sea levels are near the lowest in the last 7,000 years.

Two studies, independently published, identified Mid-Holocene sea levels in northern Norway (north of the Arctic Circle) as being 7 to 9 meters higher than today before declining to the present (Balascio et al., 2024, Nielsen et al., 2024). [emphasis, links added]

This region of the Arctic was warm enough to support human settlements and boat harbors during the Medieval Warm Period.

As the climate deteriorated into the Little Ice Age cooling centuries after the Medieval warmth, the accompanying sea level fall led to abandoned residences, ships, and harbors.

The seas had become too shallow to sail in.

MWP 1.5C Warmer Than 1900–Says HH Lamb

by P. Homewood, Apr 1, 2024 in NotaLotofPeopleKnowThat


The Central England Temperature series is the longest running in existence, but still only goes back to 1659, pretty much the depth of the Little Ice Age, so it tells us little of real meaning.

However there exist many very real measures of temperatures going back much further – and I am not referring to the fraudulently used tree rings and the like.

HH Lamb published this chart in his book “Climate: Past, Present and Future” in 1977:

The State of the Great Barrier Reef 2024(.pdf)

by P. Ridd, Mar 2204, in AustralianEnvironmentFoundation


Table of Contents
Chapter 1: What is the Great Barrier Reef? 4
Chapter 2: The Great Barrier Reef and its coral: The Data. 11
2.1 The area and number of coral reefs on the Great Barrier Reef 11
2.2 Coral Cover: the amount of coral on the Great Barrier Reef. 11
2.3 Coral growth rates (calcification) 19
Chapter 3: Hot-water ‘bleaching’ on the Great Barrier Reef 23
3.1 Introduction 23
3.2 Are bleaching events a new phenomenon? 23
3.3 Corals and their algal friends. 25
3.4 Bleaching is not usually lethal: it is a survival strategy. 27
3.5 Analysis of past GBR bleaching events. 29
3.6: Excuses for Failed Bleaching Predictions 31
3.7 Corals Like it Hot. 33
Chapter 4: Impact of agriculture on coral 35
4.1 Introduction. 35
4.2 Water flushing time of the GBR. 36
4.3: Nutrient ‘pollution’. 38
4.4 Sediment ‘pollution’. 42
4.5 Pesticides. 49
Chapter 5: Stretching the GBR to the coast. 54
5.1 Introduction. 54
5.2 Inshore Reefs. 54
5.3 Mangrove Swamps. 61
5.4 Seagrass beds. 63
5.5 Coastal Freshwater ecosystems. 68
5.6 Importance of Coastal ecosystems to the Great Barrier Reef. 69
Chapter 6 Summary and conclusions 71
Appendix Usefulness of coral cover measurements. 74
About the Author 79
Acknowledgments

Calls for inquiry into Climate Change Committee

by P. Homewood, Mar 11, 2024 in NotaLotofPeopleKnowThat


More New Studies Indicate There Has Been No Climate-Induced Precipitation Trend Since The 1800s

by K. Richard, Mar 11, 2024 in NoTricksZone


CO2-induced global warming was supposed to intensify the hydrological cycle and extreme precipitation. It hasn’t.

New research (Mitchell and Knapp, 2024) at a southeastern United States study site indicates there has been no significant trend in either total precipitation or intense rainfall events (IRE) over the last 250 years (1770-2020).

However, there was more IRE precipitation from 1936-1959 than from 1960-2020. In fact, the most recent 60 years has the lowest record of extreme precipitation during the study, with averages of 81.20 mm for 1770–1935, 230.45 mm for 1936–1959, but just 168.27 mm during 1960–2020.

No, CNN, Climate Change Is Not Driving Doomsday Glacier’s Decline

by S. Burnett, Mar 5, 2024 in ClimateChangeDispatch


A CNN story implies that supposed human-caused climate change is causing the Thwaites Glacier to melt, causing sea level rise. This is false.

Data show that Antarctica has not been warming. Also, the study CNN cited itself shows the glacier has declined dramatically and recovered repeatedly in the past, all without human contribution, suggesting the present decline is part of a natural cycle. [emphasis, links added]

At approximately the size of Florida, the Thwaites Glacier is the broadest glacier on Earth. The Thwaites Glacier is often referred to as the “Doomsday Glacier,” based on the belief that a complete collapse would cause as much as two feet of sea level rise over time.

The CNN story, “The ‘Doomsday Glacier’ is rapidly melting. Scientists now have evidence for when it started and why,” discusses a new study published in the journal Proceedings of the National Academy of Sciences, which determined when the present decline began.

“By analyzing marine sediment cores extracted from beneath the ocean floor, researchers found the glacier began to significantly retreat in the 1940s, likely kicked off by a very strong El Niño event — a natural climate fluctuation which tends to have a warming impact,” reports CNN.

“Since then, the glacier has been unable to recover, which may reflect the increasing impact of human-caused global warming, according to the report.”

Although the commencement of … Thwaites’ decline may now have been determined, any prognostications about future trends for the glacier are pure speculation, unsupported by historical evidence or data about present Antarctic trend.
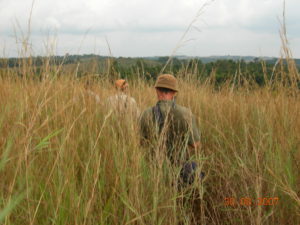
The underlying reports determined that the Thwaites glacier’s decline commenced in the 1940s probably prompted by a powerful El Nino event that warmed the abutting waters.

….

The Anthropocene is dead. Long live the Anthropocene

by P. Voosen, Mar 5, 2024 in AAASScience


For now, we’re still in the Holocene.

Science has confirmed that a panel of two dozen geologists has voted down a proposal to end the Holocene—our current span of geologic time, which began 11,700 years ago at the end of the last ice age—and inaugurate a new epoch, the Anthropocene. Starting in the 1950s, it would have marked a time when humanity’s influence on the planet became overwhelming. The vote, first reported by The New York Times, is a stunning—though not unexpected—rebuke for the proposal, which has been working its way through a formal approval process for more than a decade.

“The decision is definitive,” says Philip Gibbard, a geologist at the University of Cambridge who is on the panel and serves as secretary-general of the International Commission on Stratigraphy (ICS), the body that governs the geologic timescale. “There are no outstanding issues to be resolved. Case closed.”


A New 1787-2005 Temperature Reconstruction Determines The Coldest 50-Year Period Was 1940-1993

by K. Richard, Mar 4, 2024 in NoTricksZone


The warmest 50-year period in northeastern China occurred from 1844-1893.

Li et al., 2024

“Compared with single years, in general, high or low temperatures that persist for many years will more significantly affect the growth of trees [30]. When we defined years with T12-1 ≥ −10.73 °C (Mean + 1σ) and T12-1 ≤ −12.61 °C (Mean − 1σ) as extreme warm years and cold years, respectively, the reconstruction for the period of 1787–2005 contained 31 cold years and 36 warm years (Table 4). The extreme cold/warm events lasting for three or more consecutive years were discovered in 1965–1967 and 1976–1978/1791–1798, 1844–1849 and 1889–1891. An 11-year smoothing average of the reconstructed T12-1 series was performed to reveal multi-year and interdecadal variations and to detect the several prolonged cold and warm periods (Figure 5d). After smoothing with an 11-yr moving average, cold periods occurred in 1822–1830 (mean T12-1 = −12.7 °C) and 1957–1970 (mean T12-1 = −12.7 °C), while a warm period occurred in 1787–1793 (mean T12-1 = −10.4 °C) (Figure 5d). Rapid and sustained cooling was observed in the reconstructed series in the years 1790–1826 (T12-1 range −10.3 °C to −12.8 °C, mean = −12.0 °C) and 1939–1969 (T12-1 range −11.6 °C to −12.7 °C, mean = −12.1 °C), where the rates of cooling were about 0.067 °C/year and 0.035 °C/year, respectively (Figure 5d). The two cooling events may be due to the decrease in solar activity [48,49,50]. Using a 50-year time scale, the highest temperature occurring during 1787–2005 was from 1844 to 1893 (T12-1 range −12.79 °C to −9.41 °C, mean = −11.15 °C), similar results were also obtained by Zhu et al. and Jiang et al., while the lowest temperature was from 1940–1993 (T12-1 range −13.57 °C to −10.26 °C, mean = −12.13 °C) (Figure 5d) [33].”

How Geology And Rocks Tell The Story Of Earth’s Climatic Past

by. J. Duhamel, Mar 4, 2024 in ClimateChangeDispatch


I am a geologist which means I have rocks in my head and some of those rocks have recorded the climate history of Earth. Here is their story.

We will start with the big picture.

The graphic below [after the jump] shows the estimated temperature and atmospheric carbon dioxide (CO2) content for the past 600 million years. [emphasis, links added]

The blue line is the estimated temperature; the black line is the estimated CO2 content of the atmosphere.

Notice that for much of the past 600 million years, the temperature has been about 12°C warmer than it is now and life has flourished. (Note that the climate crazies claim that if the global temperature increases by 2°C above present, we will die.)

CO2 temps graph

Click to enlarge

The dips in the temperature curve are ice ages. Ice ages have occurred on a cycle of about 145 million years. Ice ages consist of glacial epochs and warmer interglacial periods. We are now in an interglacial period. (In the popular vernacular, glacial epochs are often called “ice ages.”)

The glacial epoch cycle happens whenever our solar system, in its travels around the center of our galaxy, goes through some spiral arms of the galaxy with very dense clusters of stars that bombard the Earth with more cosmic rays, which produce more clouds and other effects in the atmosphere, which limit the amount sunlight that gets to Earth’s surface.

Carbon NetZero: A Ridiculous Solution to an Imaginary Problem VIDEO

Dr. Patrick Moore, March 4, 2024 in FriendsofScience  


VIDEO 57’54”

3 900 vues 28 févr. 2024
https://www.youtube.com/watch?v=GlcAKE04YvM

Carbon NetZero: A Ridiculous Solution to an Imaginary Problem – Dr. Patrick Moore presents a bit of his personal history as a Greenpeace Warrior, and now a compendium of his work as a warrior for common sense on climate and environmental problems. Drawing on some of the work from his book “Fake and Invisible Catastrophes and Threats of Doom,” Dr. Moore exposes many of these climate and environmental myth

Warming Earth Has Changed U.S. Hardiness Zones

by  K. Hansen, March 4, 2024 in WUWT


Several times I have had readers at WUWT ask in comments:  “If the climate is changing, why haven’t the planting zone maps changed?”

Well, they have and they do.  The U.S. Department of Agriculture issues a new U.S.D.A. “Plant Hardiness Zone Map” periodically.  A new version of the map was just released on Nov. 15, 2023.  I became aware of it because my wife is an avid gardener and follows our local agricultural County Cooperative Extension news.

When she followed the link to the new Plant Hardiness map and checked our very local area, she was surprised to see that it had “warmed” here by 5°F.   Here is the bit of the page she was looking at:

She was a bit perplexed by this news, as we have been having not “hot” years but cooler years recently. It took me a minute to sort through it to see that the drop down was not clear on what temperature change they were talking about.  That temperature change elevated us one half a zone from zone 5b to zone 6a.


EXCLUSIVE: A Third of U.K. Met Office Temperature Stations May Be Wrong by Up to 5°C, FOI Reveals

by C. Morrison, March 1, 2024 in TheDailySceptic


Nearly one in three (29.2%) U.K. Met Office temperature measuring stations have an internationally-defined margin of error of up to 5°C. Another 48.7% of the total 380 stations could produce errors up to 2°C, meaning nearly eight out of ten stations (77.9%) are producing ‘junk’ or ‘near junk’ readings of surface air temperatures. Arguably, on no scientific basis should these figures be used for the Met Office’s constant promotion of the collectivist Net Zero project. Nevertheless, the state-funded operation frequently uses them to report and often catastrophic rises in temperature of as little as 0.01°C.

Under a freedom of information request, the Daily Sceptic has obtained a full list of the Met Office’s U.K. weather stations, along with an individual class rating defined by the World Meteorological Office. These CIMO ratings range from pristine class 1 and near pristine class 2, to an ‘anything goes’ or ‘junk’ class 5. The CIMO ratings penalise sites that are near any artificial heat sources such as buildings and concrete surfaces. According to the WMO, a class 5 site is one where nearby obstacles “create an inappropriate environment  for a meteorological measurement that is intended to be representative of a wide area”. Even the Met Office refers to sites next to buildings and vegetation as “undesirable”. It seems class 5 sites can be placed anywhere, and they come with a WMO warning of “additional estimated uncertainties added by siting up to 5°C”; class 4 notes “uncertainties” up to 2°C, while class 3 states 1°C. Only 13.7%, or 52 of the Met Office’s temperature and humidity stations come with no such ‘uncertainty’ warnings attached.

The above graph shows the percentage totals of each class. Class 1 and 2, identified in green, account for just 6.3% and 7.4% of the total respectively. Class 3 identified as orange comes in at 8.4%. The graph shows the huge majorities enjoyed by the darkening shades of red showing classes 4 and 5. It is possible that the margins of error identified for classes 3, 4 and 5 could be a minus amount – if for instance the measuring device was sited in a frost hollow – but the vast majority are certain to be pushed upwards by heat corruptions.


Europe’s Consensus On Climate Is Crumbling

by W. Münchau, Feb 29, 202 in ClimateChangeDispatch


At stake in the European elections in June this year will be everything that defines the modern EU: a large volume of net zero legislation, a values-based foreign policy, and ever-more intrusive business regulation.

Polls suggest the centrist majority that has supported these policies is growing slimmer. [emphasis, links added]

Ursula von der Leyen [pictured above] has been the quintessential representative of that majority. Born in Brussels, German by nationality, proposed by France, she was the perfect candidate for European Commission president in late 2019.

Now she is seeking a second term. Whether she will succeed will depend to a large extent on whether the centrist four-party coalition that supported her in 2019 will hold.

All over Europe, we are now seeing a backlash against the kind of policies the Von der Leyen Commission represents.

The far right is part of that response, but the main political shift has been inside Von der Leyen’s own political group, the European People’s Party (EPP), of which the German CDU/CSU is the largest member.

This backlash follows one of the most hectic political phases in recent EU history. When Covid struck in early 2020, Von der Leyen was instrumental in setting up the EU’s recovery fund to help countries deal with the economic consequences of the pandemic.

Then came the Green Deal, a hefty tranche of legislation on renewable energy, land use, forestry, energy efficiency, emission standards for cars and trucks, and a directive on energy taxes.

There was also a tightening of standards on pesticides, air quality, water pollution, and wastewater.

Farmers are resisting this program because it affects their livelihoods. Industrialists, too, are unhappy. A big part of the Green Deal was its industrial policy; the flagship legislation was the Net Zero Industry Act.

The industry used to be the EU’s strongest supporter.

But with the new laws came new bureaucracy: now, all EU-funded investment must include a green component of at least 30 percent, while a carbon border adjustment mechanism, to take effect in 2026, will penalize imports that do not meet EU carbon-emission standards. Together, EU legislation in the last few years amounts to a near-total corporate regime change.

Compliance with some regulations is virtually impossible for companies without dedicated legal teams. It is going to get worse.

Under discussion right now is a supply-chain law that would make European companies responsible for human rights abuses in their supply chain – including the suppliers of their suppliers.

I expect that the hyperactive phase of this green agenda will end with the elections in June. Some of it might even go into reverse. I am even starting to doubt whether the EU will ever enforce the 2035 target for phasing out fossil-fuel-driven cars.

This is an industrial-policy disaster in the making because Europe’s carmakers are having trouble selling their electric cars.

Geologically Generated Ice Cycles And Climate-Related Phenomena

by J.E. Kamis, Feb 28, 2024 in ClimateChangeDispatch


The term “Ice Age” implies that covering Earth’s surface with ice and then melting it is a single event.

As explained below, this process is not a single event but rather a reoccurring cycle that has three distinct phases: Ice Melt/End Phase, Ice Increase/Recovery Phase, and Normal Ice Extent/Stable Phase.

Ice Melt/End Phase

Approximately every 100,000 years, the Earth’s glaciers and seas reach their maximum extent. Suddenly and within 5,000 years nearly all the ice melts. I term this the Ice Melt Phase.

So, what causes this rapid melting of the ice? It is a geologically induced pulse of heat and gas emitted from all of Earth’s geological features. A more detailed explanation of the Ice Melt Phase follows.

In 1941 Serbian mathematician Milutin Milankovitch discovered that every 100,000 years, the Earth’s orbit around the sun, tilt angle of its axis, and wobble-type movement around the axis changes. Scientists called this process a Milankovitch Cycle.

Milankovitch concluded that these astronomical changes affected Earth’s long-term climate. Others have shown that these astronomical changes also act to greatly increase the gravitational stress on Earth.

Figure 1. 50,000-mile-long interconnected network of ocean floor fault zones and ice extent during an Ice Cycle. (Image credit Wikipedia, some labeling by J. Kamis).

In my opinion, this stress activates all of Earth’s geological features, most importantly the 50,000-mile-long interconnected network of deep ocean-floor fault zones (Figure 1). These fault zones form the boundary between continents and large segments of ocean-floor rock layers.

Meteorologist Debunks TIME Mag’s Claim That Jan 2024 Was Hottest On Record

by A. Watts, Feb 19, 2024 in ClimateChangeDispatch


An article in TIME Magazine (TIME) claims that January 2024 was the hottest ever on record for the planet. Titled, 2024 Had the Hottest January on Record Following 2023’s Hottest Year on Record the article is based on a single source of temperature data.

Data from multiple other sources of temperature measurements refute this claim. [emphasis, links added]

TIME refers to the Copernicus EU climate service as the source for its alarming claim. Copernicus EU issued a press release claiming:

January 2024 was the warmest January on record globally, with an average ERA5 surface air temperature of 13.14°C, 0.70°C above the 1991-2020 average for January and 0.12°C above the temperature of the previous warmest January, in 2020.

The month was 1.66°C warmer than an estimate of the January average for 1850-1900, the designated pre-industrial reference period.

The problem with that is that they are using a reference period of 1850 to 1900 that no other climate data source uses; a period, not coincidentally, more than 100 years of global warming ago when the Earth was cooler than today.

For example, NASA Goddard Institute for Space Studies (GISS) produced a map of the globe that shows a significantly lower global temperature for January 2024.

The GISS global value was just 1.20°C compared to the 1.66°C claimed by Copernicus is different because NASA GISS is using a base period of 1951 to 1980.

Copernicus seemingly cherry-picked the reference period to fit the climate crisis narrative, and TIME was too uninterested in seeking and presenting the truth to investigate the extraordinary claim, instead reporting it as an unchallenged fact.

The Hockey Stick Trial: How Science Died In A D.C. Courtroom

by R .Darwall, Feb 20, 2024 in ClimateChangeDispatch


“Science,” wrote the philosopher Karl Popper, “is one of the very few human activities – perhaps the only one – in which errors are systematically criticized and fairly often, in time, corrected.”

The sub-title of Popper’s 1963 book Conjectures and Refutations, in which he argued that science progresses through inspired conjectures checked by attempts to refute them through criticism, is “The Growth of Scientific Knowledge.” [emphasis, links added]

Now, a six-person jury in Washington, DC has refuted Popper’s formulation of the uniqueness of science, finding in favor of climate scientist Michael Mann in the defamation suit he brought against Rand Simberg and Mark Steyn dating back to 2012.

Central to Mann’s case was his attempt to reconstruct global temperature over the previous millennium – the iconic “hockey stick” graph.

The graph shows global temperatures purportedly falling for centuries and suddenly shooting upward with the advent of the Industrial Revolution.

Mann’s hockey stick representation was derived principally from selected tree-ring data based on the assumption that tree rings constitute accurate proxies for temperature and are not contaminated by confounding factors such as rainfall, seasonal variability, and levels of carbon dioxide in the atmosphere.

The results that Mann produced are also sensitive to decisions on and application of statistical techniques.

There can be little doubt of the hockey stick’s historical importance in developing and propagating what became the dominant scientific paradigm of climate change.

Climate Model Bias 1: What is a Model?

by A. May, Feb 29, 2024 in WUWT


There are three types of scientific models, as shown in figure 1. In this series of seven posts on climate model bias we are only concerned with two of them. The first are mathematical models that utilize well established physical, and chemical processes and principles to model some part of our reality, especially the climate and the economy. The second are conceptual models that utilize scientific hypotheses and assumptions to propose an idea of how something, such as the climate, works. Conceptual models are generally tested, and hopefully validated, by creating a mathematical model. The output from the mathematical model is compared to observations and if the output matches the observations closely, the model is validated. It isn’t proven, but it is shown to be useful, and the conceptual model gains credibility.

Models are useful when used to decompose some complex natural system, such as Earth’s climate, or some portion of the system, into its underlying components and drivers. Models can be used to try and determine which of the system components and drivers are the most important under various model scenarios.

Besides being used to predict the future, or a possible future, good models should also tell us what should not happen in the future. If these events do not occur, it adds support to the hypothesis. These are the tasks that the climate models created by the Coupled Model Intercomparison Project (CMIP)[1] are designed to do. The Intergovernmental Panel on Climate Change (IPCC)[2] analyzes the CMIP model results, along with other peer-reviewed research, and attempts to explain modern global warming in their reports. The most recent IPCC report is called AR6.[3]

In the context of climate change, especially regarding the AR6 IPCC[4] report, the term “model,” is often used as an abbreviation for a general circulation climate model.[5] Modern computer general circulation models have been around since the 1960s, and now are huge computer programs that can run for days or longer on powerful computers. However, climate modeling has been around for more than a century, well before computers were invented. Later in this report I will briefly discuss a 19th century greenhouse gas climate model developed and published by Svante Arrhenius.

Besides modeling climate change, AR6 contains descriptions of socio-economic models that attempt to predict the impact of selected climate changes on society and the economy. In a sense, AR6, just like the previous assessment reports, is a presentation of the results of the latest iteration of their scientific models of future climate and their models of the impact of possible future climates on humanity.

Introduction

Modern atmospheric general circulation computerized climate models were first introduced in the 1960s by Syukuro Manabe and colleagues.[6] These models, and their descendants can be useful, even though they are clearly oversimplifications of nature, and they are wrong[7] in many respects like all models.[8] It is a shame, but climate model results are often conflated with observations by the media and the public, when they are anything but.

Green Billionaires Press Hollywood to Promote Armageddon Climate Messages in Movies

by C. Morrison, Feb27, 2024 in TheDailySceptic


Green billionaires are pouring money into discreet campaigns to persuade Hollywood writers to catastrophise the climate in future film and television scripts. One of their main vehicles is Good Energy, which tells writers that showing anger, depression, grief or other emotion in relation to the climate crisis, “can only make characters more relatable”. Los Angeles-based Good Energy is funded by numerous billionaire foundations including Bloomberg Philanthropies, the Sierra Club and the Climate Emergency Fund; the latter operation is part-funded by Aileen Getty and is one of the paymasters of the Just Stop Oil pests.

Good Energy aims to weave climate alarm into all types of film-making, “especially” if it is not about climate. With the support of Bloomberg, it recently published ‘Good Energy – A Playbook for Screenwriting in the Age of Climate Change’. It claims the Playbook is “now the industry’s go-to guide to incorporating climate into any storyline or genre”. As with almost all green campaigning groups, Good Energy would not exist without the support of billionaire funding. These operations seek a supra-national collectivist Net Zero solution to a claimed climate emergency. Good Energy acknowledges it would not exist without this funding, adding, “as collaborators and champions, each has provided a unique contribution for which we are endlessly grateful”.

La géologie, une science plus que passionnante … et diverse