Archives de catégorie : unclassified

Has the Sun’s true role in global warming been miscalculated?

by CeresTeam, Oct 2023 in CeresScience


A new international study published in the scientific peer-reviewed journal, Research in Astronomy and Astrophysics, by 20 climate researchers from 12 countries suggests that the UN’s Intergovernmental Panel on Climate Change (IPCC) might have substantially underestimated the role of the Sun in global warming.

The article began as a response to a 2022 commentary on an extensive review of the causes of climate change published in 2021. The original review (Connolly and colleagues, 2021) had suggested that the IPCC reports had inadequately accounted for two major scientific concerns when they were evaluating the causes of global warming since the 1850s:

  1. The global temperature estimates used in the IPCC reports are contaminated by urban warming biases.

  2. The estimates of solar activity changes since the 1850s considered by the IPCC substantially downplayed a possible large role for the Sun.

On this basis, the 2021 review had concluded that it was not scientifically valid for the IPCC to rule out the possibility that global warming might be mostly natural.

The findings of that 2021 review were disputed in a 2022 article by two climate researchers (Dr. Mark Richardson and Dr. Rasmus Benestad) for two main reasons:

  1. Richardson and Benestad (2022) argued that the mathematical techniques used by Connolly and colleagues (2021) were inappropriate and that a different set of mathematical techniques should have been used instead.

  2. They also argued that many of the solar activity records considered by Connolly and colleagues (2021) were not up-to-date.

They suggested that these were the reasons why Connolly and colleagues (2021) had come to a different conclusion from the IPCC.

This new 2023 article by the authors of the 2021 review, has addressed both of these concerns and shown even more compelling evidence that the IPCC’s statements on the causes of global warming since 1850 are scientifically premature and may need to be revisited.

The authors showed that the urban component of the IPCC’s global temperature data shows a strong warming bias relative to the 98% of the planet that is unaffected by urbanization. However, they also showed that urbanized data represented most of the weather station records used.


While the IPCC only considered one estimate of solar activity for their most recent (2021) evaluation of the causes of global warming, Connolly and colleagues compiled and updated 27 different estimates that were used by the scientific community.

Several of these different solar activity estimates suggest that most of the warming observed outside urban areas (in rural areas, oceans, and glaciers) could be explained in terms of the Sun. Some estimates suggest that global warming is a mixture of human and natural factors. Other estimates agreed with the IPCC’s findings.

For this reason, the authors concluded that the scientific community is not yet in a position to establish whether the global warming since the 1850s is mostly human-caused, mostly natural or some combination of both.

Surveys Show Vast Bulk of Antarctica Is Stable or Growing

by  H.S. Sterling, June. 16, 2024 in WUWT


We hear a lot in the mainstream media about massive ice loss in Antarctica and how it may radically increase sea level rise. The West Antarctic ice sheet and ice on the Antarctic peninsula are in decline, with some massive glaciers threatening to break off; however, conditions there are not the same as for the vast bulk of the continent. First, the subsurface geothermal/volcanic activity that is driving much of the melting in West Antarctica is not affecting the vast bulk of the continent. And the shifting ocean oscillations, which affect the continent’s climate as a whole, have a much greater, more direct impact on the Antarctic peninsula, the northern-most part of the continent, a relatively narrow spit of land surrounded by oceans and beset be clashing currents.

The conditions of the sea ice around Antarctica don’t matter in the sea level equation. Sea ice changes dramatically each season, waxing and waning with the seasons and the currents. For the limited period for which we have consistent measurements, Antarctica’s sea ice has set new records for extent and for low levels during the most recent period of climate change. Neither, however, impact sea levels since floating ice doesn’t displace water.

NASA reported in 2015 that because East Antarctica, which makes up the bulk of the continent, was adding ice and snow, Antarctica as whole may, in fact, be gaining ice on net, implying it could be modestly taking away from sea level rise rather than adding to it. At least from 1992 to 2015, when the report was published.

Man Made Global Warming

by P. Homewood, Apr 14, 2024 in NotaLotOfPeopleKnowThat


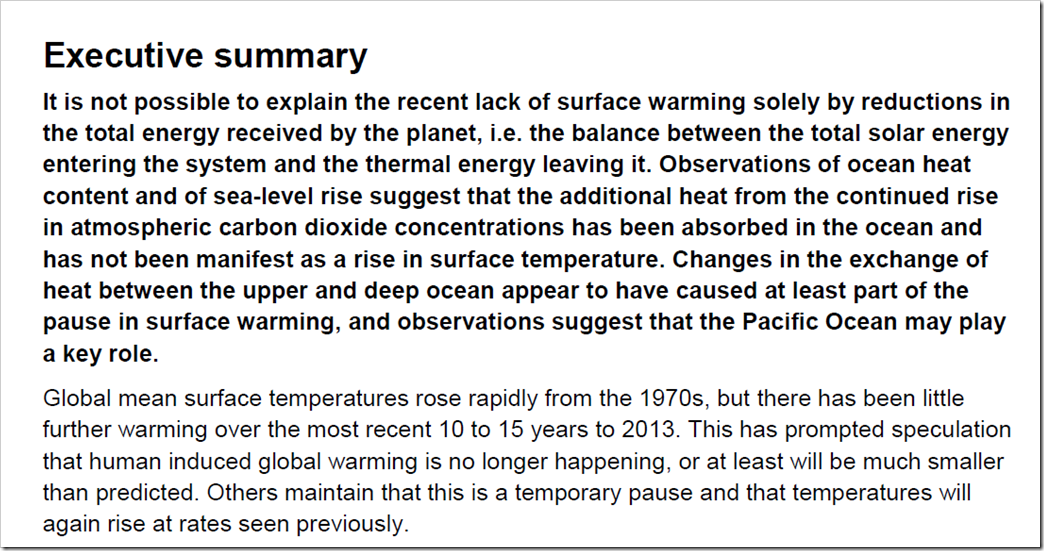
image

http://web.archive.org/web/20130927101652/https://www.metoffice.gov.uk/media/pdf/q/0/Paper2_recent_pause_in_global_warming.PDF

Once upon a time there was The Pause.

For a decade and a half, global temperatures stopped rising, an embarrassment for climate scientists. Even the Met Office published a long study in 2013 into the possible reasons.

But while one team at the Met Office were scratching their heads, another was busy at work eliminating the problem.

After all, if the data does not support the theory, you simply change the data.

The Met Office’s Hadley Centre, in conjunction with the disgraced Climate Research Unit at the UEA, had for years published their global temperature series known as HADCRUT3. They regarded it as the gold standard of datasets.

But just a year after the Met Office’s paper on the pause, a new version was rushed out, HADCRUT4, which conveniently removed that pause.

By 2014, when HADCRUT3 was formally replaced, the new version had added about a tenth of a degree to warming since 2000.

Professor Valentina Zharkova and the Little Ice Age Which Has Already Started

by V. Zharkova, Apr 11, 2024 in FreedomResearch


Astrophysicist Professor Valentina Zharkova explains that instead of CO2, it is the Sun that drives the climate change and because of its decreasing activity we should be ready for a colder period.

“CO2 is not a bad gas,” says Valentina Zharkova, a professor at the Northumbria University in Newcastle, UK. On the contrary, she points out, every garden centre uses it in its greenhouses to make plants lush and green. “We actually have a CO2 deficit in the world, and it’s three to four times less than the plants would like,” she notes, adding that the proportion of CO2 in the atmosphere has been at much higher levels throughout our planet’s history than it is now.

In fact, over the last 140 million years, the amount of CO2 in the atmosphere has been steadily decreasing and only now slightly starting to rise. It is currently around 420 parts per million (ppm), or 0.042%. 140 million years ago, it was estimated at 2,500 ppm (0.25%), or about six times higher. And it also meant a greener and more biodiverse world. If CO2 were to fall below 150 ppm (0.015%), it would already mean the extinction of vegetation and all other life. We came close to that during the last glacial maximum when it was at 182 ppm (0.018%).

Zharkova says that the fact that CO2 levels in the atmosphere are now increasing is a good thing. “We don’t need to remove CO2 because we would actually need more of it. It’s food for plants to produce oxygen for us. The people who say CO2 is bad are obviously not very well educated at university or wherever they studied. Only uneducated people can come up with such absurd talk that CO2 should be removed from the air,” says Zharkova.

UAH Global Temperature Update for March, 2024: +0.95 deg. C

by R. Spencer, Apr 2, 2024 in WUWT


The Version 6 global average lower tropospheric temperature (LT) anomaly for March, 2024 was +0.95 deg. C departure from the 1991-2020 mean, up slightly from the February, 2024 anomaly of +0.93 deg. C, and setting a new high monthly anomaly record for the 1979-2024 satellite period.

New high temperature records were also set for the Southern Hemisphere (+0.88 deg. C, exceeding +0.86 deg. C in September, 2023) and the tropics (+1.34 deg. C, exceeding +1.27 deg. C in January, 2024). We are likely seeing the last of the El Nino excess warmth of the upper tropical ocean being transferred to the troposphere.


The extraordinary climate events of 2022-24

by J. Vinos, March 24, 2024 in ClimateEtc


The unlikely volcano, the warmest year, and the collapse of the polar vortex.

The climate events of 2022-24 have been were truly extraordinary. From an unlikely undersea volcanic eruption to the warmest year on record to the collapse of the polar vortex after three sudden stratospheric warming events. This rare convergence presents a unique learning opportunity for climatologists and climate aficionados alike, offering insights into a climate event that may not be repeated for hundreds or even thousands of years.

  1. January 2022, the unlikely volcano

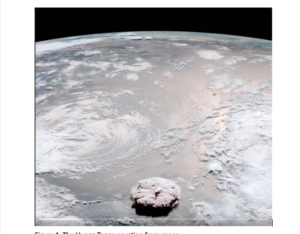
Never before have we witnessed an undersea volcanic eruption with a plume capable of reaching the stratosphere and depositing a large amount of vaporized water. This extraordinary event occurred in January 2022 when the Hunga Tonga volcano erupted. The conditions for such an event are rare: the volcano must be deep enough to propel enough water with the plume, but not too deep to prevent it from reaching the stratosphere. Most undersea volcanoes do not produce plumes at all, which makes Hunga Tonga’s eruption all the more remarkable.

The Hunga Tonga volcano occupied a unique “sweet spot” at a depth of 150 meters the day before the eruption. In addition, the eruption itself must be exceptionally powerful for water vapor to rise into the stratosphere. The January 2022 eruption of Hunga Tonga was the most powerful in 30 years, since the 1991 eruption of Mt. Pinatubo.

Figure 1. The Hunga Tonga eruption from space.

  1. 2023, the hottest year on record

Beginning in June 2023, the last seven months of the year marked the warmest period on record, significantly exceeding previous records. Such an event is quite remarkable, given the considerable temperature variability observed from month to month. But how unlikely is it?

  1. January-March 2024, the collapse of the polar vortex

The polar vortex is a circular wind pattern that develops on rotating planets with an atmosphere. It results from the conservation of potential vorticity, a property depending on the Coriolis force and the potential temperature gradient. The potential temperature refers to the portion of the temperature of an air parcel that is not affected by its potential energy, and is often defined as the temperature the parcel would have if it were brought to the surface (1,000 hPa).

  1. What can we expect in the near future?

The unlikely volcanic eruption is the likely cause of the extraordinary warming, which in turn led to the occurrence of the unprecedented three SSW events. Our understanding of the effects of these events supports this interpretation.

A New 1787-2005 Temperature Reconstruction Determines The Coldest 50-Year Period Was 1940-1993

by K. Richard, Mar 4, 2024 in NoTricksZone


The warmest 50-year period in northeastern China occurred from 1844-1893.

Li et al., 2024

“Compared with single years, in general, high or low temperatures that persist for many years will more significantly affect the growth of trees [30]. When we defined years with T12-1 ≥ −10.73 °C (Mean + 1σ) and T12-1 ≤ −12.61 °C (Mean − 1σ) as extreme warm years and cold years, respectively, the reconstruction for the period of 1787–2005 contained 31 cold years and 36 warm years (Table 4). The extreme cold/warm events lasting for three or more consecutive years were discovered in 1965–1967 and 1976–1978/1791–1798, 1844–1849 and 1889–1891. An 11-year smoothing average of the reconstructed T12-1 series was performed to reveal multi-year and interdecadal variations and to detect the several prolonged cold and warm periods (Figure 5d). After smoothing with an 11-yr moving average, cold periods occurred in 1822–1830 (mean T12-1 = −12.7 °C) and 1957–1970 (mean T12-1 = −12.7 °C), while a warm period occurred in 1787–1793 (mean T12-1 = −10.4 °C) (Figure 5d). Rapid and sustained cooling was observed in the reconstructed series in the years 1790–1826 (T12-1 range −10.3 °C to −12.8 °C, mean = −12.0 °C) and 1939–1969 (T12-1 range −11.6 °C to −12.7 °C, mean = −12.1 °C), where the rates of cooling were about 0.067 °C/year and 0.035 °C/year, respectively (Figure 5d). The two cooling events may be due to the decrease in solar activity [48,49,50]. Using a 50-year time scale, the highest temperature occurring during 1787–2005 was from 1844 to 1893 (T12-1 range −12.79 °C to −9.41 °C, mean = −11.15 °C), similar results were also obtained by Zhu et al. and Jiang et al., while the lowest temperature was from 1940–1993 (T12-1 range −13.57 °C to −10.26 °C, mean = −12.13 °C) (Figure 5d) [33].”

Europe’s Consensus On Climate Is Crumbling

by W. Münchau, Feb 29, 202 in ClimateChangeDispatch


At stake in the European elections in June this year will be everything that defines the modern EU: a large volume of net zero legislation, a values-based foreign policy, and ever-more intrusive business regulation.

Polls suggest the centrist majority that has supported these policies is growing slimmer. [emphasis, links added]

Ursula von der Leyen [pictured above] has been the quintessential representative of that majority. Born in Brussels, German by nationality, proposed by France, she was the perfect candidate for European Commission president in late 2019.

Now she is seeking a second term. Whether she will succeed will depend to a large extent on whether the centrist four-party coalition that supported her in 2019 will hold.

All over Europe, we are now seeing a backlash against the kind of policies the Von der Leyen Commission represents.

The far right is part of that response, but the main political shift has been inside Von der Leyen’s own political group, the European People’s Party (EPP), of which the German CDU/CSU is the largest member.

This backlash follows one of the most hectic political phases in recent EU history. When Covid struck in early 2020, Von der Leyen was instrumental in setting up the EU’s recovery fund to help countries deal with the economic consequences of the pandemic.

Then came the Green Deal, a hefty tranche of legislation on renewable energy, land use, forestry, energy efficiency, emission standards for cars and trucks, and a directive on energy taxes.

There was also a tightening of standards on pesticides, air quality, water pollution, and wastewater.

Farmers are resisting this program because it affects their livelihoods. Industrialists, too, are unhappy. A big part of the Green Deal was its industrial policy; the flagship legislation was the Net Zero Industry Act.

The industry used to be the EU’s strongest supporter.

But with the new laws came new bureaucracy: now, all EU-funded investment must include a green component of at least 30 percent, while a carbon border adjustment mechanism, to take effect in 2026, will penalize imports that do not meet EU carbon-emission standards. Together, EU legislation in the last few years amounts to a near-total corporate regime change.

Compliance with some regulations is virtually impossible for companies without dedicated legal teams. It is going to get worse.

Under discussion right now is a supply-chain law that would make European companies responsible for human rights abuses in their supply chain – including the suppliers of their suppliers.

I expect that the hyperactive phase of this green agenda will end with the elections in June. Some of it might even go into reverse. I am even starting to doubt whether the EU will ever enforce the 2035 target for phasing out fossil-fuel-driven cars.

This is an industrial-policy disaster in the making because Europe’s carmakers are having trouble selling their electric cars.

Why Climate Scientists were Duped into Believing Rising CO2 will Harm Coral and Mollusks

by J. Steele, Feb 24, 2024 in WUWT


Coral build reefs by producing limestone, or calcium carbonate. The great diversity of shell building mollusks, like clams and oysters, also build their shells out of calcium carbonate.  So, scientists assumed that these organisms just pulled carbonate ions from the surrounding sea water and joined it with abundant calcium ions to make reefs and shells, a process referred to as “calcification”. Thus, many scientists then expressed their heart-felt concerns that more CO2 will reduce the ocean’s carbonate ions and thus stress coral reef building and mollusk shell building.

Indeed, the increasing absorption of human produced carbon dioxide by the oceans can very slightly lower pH. In other words, more CO2 increases the oceans’ concentration of H+ ions. It is also unassailable science that when CO2 enters the water, it interacts with water molecules to produce both H+ ions and bicarbonate ions.  However, those H+ ions can then interact with carbonate ions and convert them to also form bicarbonate ions and reduce the pool of available carbonate ions. So, NOAA and hundreds of internet websites falsely told the world that “Ocean acidification slows the rate at which coral reefs generate calcium carbonate, thus slowing the growth of coral skeletons.”

However, climate scientists were apparently very ignorant regards the physiology of reef building and shell making.  In order for charged ions to pass through an organism’s lipid membranes and enter its calcification chambers, a specialized channel or transporter is required. But for over a decade now, the search for carbonate transporters has failed to find any such transporters in any of these organisms. However, abundant bicarbonate transporters (green rectangles) have been found and deemed important for making reefs and shells.

Impacts and risks of “realistic” global warming projections for the 21st century

by N. Scafetta, Feb 2024, in GeoscienceFrontier


  • Highlights

    The IPCC AR6 assessment of likely impacts and risks by 21st-century climate changes is highly uncertain.

    • Most climate models, however, run too hot, and the SSP3-7.0 and SSP5-8.5 scenarios are unlikely.

    • New climate change projections for the 21st century were generated using best-performing climate models,

    • Empirical climate modeling of natural cycles, and calibration on lower troposphere temperature data.

    • Net-zero emission policies are not necessary because SSP2-4.5 is sufficient to limit climate change hazards to manageable levels

UN COP 28: Have we dodged the loss and damage threat again?

by D. Wojick, Dec 4, 2023 in CFact


As regular readers know, I have been tracking the U.N. development of the so-called “loss and damage” issue for several years. This has been a very dangerous concept.

As promoted by the extreme alarmists, it contemplates America and other developed countries paying trillions of dollars in reparations to developing countries for the supposed damages due to climate change we have caused. There have been future damage estimates as high as $400 trillion.

At COP 27 last year, an official loss and damage fund was launched but with no specific nature. That chore was left to today’s COP 28, and it has now been done, at least a very important little bit.

Happily, the official COP decision on the loss and damage fund has now been made, and it appears harmless. I sigh with relief.

Contributions to the fund are completely voluntary. There is no claim of reparation, obligation, compensation, nothing like that. It is simply a mechanism for rendering foreign aid for natural disasters. The agreement says this: “…funding arrangements, including a fund, for responding to loss and damage are based on cooperation and facilitation and do not involve liability or compensation.”

Of course, the alarmists are going to continue to describe it as a reparation fund, but that is just the usual hype. There is no there there.

Given that the US foreign aid budget runs around $30 billion a year, there should be no problem running a bit of that through the loss and damage fund, if and when it finally gears up. Initial contributions from various countries are running between $100 million and $10 million, which is almost nothing. My understanding is the US is kicking in a trivial $17.5 million. I suspect the US Government spends that much a year on unused airplane tickets.

Nor is this $100 million a year just a single donation. The UN’s flagship Green Fund only gets about $9 billion every five years, which is just $2 billion a year. If loss and damage do that well it is still insignificant compared to the $400 trillion hype. So, for now the loss and damage threat has simply ceased to exist. It consists of voluntary peanuts.

Mind you, one big fight lies ahead, but America and the other developed countries may have little to do with it. The monster question is, who gets these peanuts?

Pretty much every country gets bad weather, which is what loss and damage funds are supposed to cover. Taken together, the developing countries’s losses and damages are huge compared to the likely funding. So, who is going to get what little there is?

The COP decision is perfectly silent on the substance of this fundamental question. But we do have a procedure of sorts.

First, there will be created a Board to oversee the fund, which should be a contentious process in itself. Then, the Board is supposed to develop the rules, which at some point have to include who qualifies to get funded for their losses and/or damages.

However, what the Board decides is then subject to the approval of the next COP, which is likely to be where the real fight happens. Given that every country that is not going to get funded can veto giving some other country funding, this could be a protracted process. It might even be unresolvable.

In fact, we have a bit of a model for an impasse. The next COP is supposed to be in Eastern Europe, but no agreement on where can be reached because every possibility has been vetoed to date.

I am not making this up. Getting every Eastern European country to agree on who, instead of them, should get the enormous cash flow of  70,000 two-week visitors may not be possible. This one-shot COP income may well exceed all the loss and damage funding. It would be hilarious if COP 29 did not occur for this reason.

In any case, the news is great. The extremely dangerous loss and damage issue has been rendered harmless. It might even be paralyzed. One can hope, and time will tell.

The 2023 Atlantic Hurricane Season Was Average–Not 4th Busiest

by P. Homewood, Dec 1, 2023 in NotaLotofPeopleKnowThat


As even CBS own chart shows, the number of hurricanes and major hurricanes has only been average.

Instead it is those named storms, which did not reach hurricane strength, that have been above average. And as we know, this is simply because we are able to spot many more of these short lived, weak storms with the help of satellites, along with the fact that many storms are now named which would not have been categorised as Tropical Storms in the past.

First, let’s look at the actual data.

The best record we have is for US landfalling hurricanes, with reliable data back as far as the 1900. According to the US Hurricane Research Division (HRD):

Because of the sparseness of towns and cities before 1900 in some coastal locations along the United States, the above list is not complete for all states. Before the Gulf of Mexico and Atlantic coasts became settled, hurricanes may have been underestimated in their intensity or missed completely for small-sized systems (i.e., 2004’s Hurricane Charley).

Can we trust projections of AMOC weakening based on climate models that cannot reproduce the past?

by G.D. McCarthy & L. Caesar, Nov 2023 in PhilosophicalTransactions


The Atlantic Meridional Overturning Circulation (AMOC), a crucial element of the Earth’s climate system, is projected to weaken over the course of the twenty-first century which could have far reaching consequences for the occurrence of extreme weather events, regional sea level rise, monsoon regions and the marine ecosystem. The latest IPCC report puts the likelihood of such a weakening as ‘very likely’. As our confidence in future climate projections depends largely on the ability to model the past climate, we take an in-depth look at the difference in the twentieth century evolution of the AMOC based on observational data (including direct observations and various proxy data) and model data from climate model ensembles. We show that both the magnitude of the trend in the AMOC over different time periods and often even the sign of the trend differs between observations and climate model ensemble mean, with the magnitude of the trend difference becoming even greater when looking at the CMIP6 ensemble compared to CMIP5. We discuss possible reasons for this observation-model discrepancy and question what it means to have higher confidence in future projections than historical reproductions.

This article is part of a discussion meeting issue ’Atlantic overturning: new observations and challenges’.

A Twitter Debate on Clintel’s IPCC AR6 Critique

by A. May, July 5, 2023 in WUWT


In May 2023, Clintel published a book (see figure 1) criticizing AR6 (IPCC, 2021), a publication that was supposed to summarize climate science research to date. We found that AR6 was biased in its reporting of recent developments in climate science, and they ignored published research contrary to their narrative that humans have caused all the warming since the Little Ice Age (the so called “preindustrial”), and that recent warming is somehow dangerous. Comments and reviews of the Clintel volume can be seen hereand on Judith Curry’s website here.

This post discusses a twitter debate about possible mistakes in the Clintel volume, specifically the Chapter 6 (written by Nicola Scafetta and Fritz Vahrenholt) discussion of the evidence that changes in the Sun affect Earth’s climate. We argue that recent evidence supports a role for the Sun in modern climate change, and the IPCC argues that the Sun has not contributed to recent (since 1750, see AR6, page 959, figure 7.6) warming or recent climate change.

We will see that Theodosios Chatzstergos, who also argues for no contribution from the Sun seems to confuse opinions with facts, and considers opinions different from his own as “mistakes.” This is a common problem with younger scientists, and undoubtably it is a product of poor scientific training in universities today. Opinions, regardless of who holds them, are not facts. Differing opinions, based on the same pool of evidence, are not mistakes, they are just different opinions. It is easy to see how “climate science” has devolved into “climate politics.”

Dr. Judith Curry praised the Clintel volume on twitter, which led to criticism from Dr. Theodosios Chatzstergos. Chatzstergos claims that Scafetta and Vahrenholt’s Chapter 6 had several errors, claims that I discuss in detail below.

Chatzstergos Point 1:

Are ENSO Regime Changes Connected To Major Climate Shifts? Are We Tipping To Cooling?

by P. Gosselin, Apr 19, 2023 in NoTricksZone


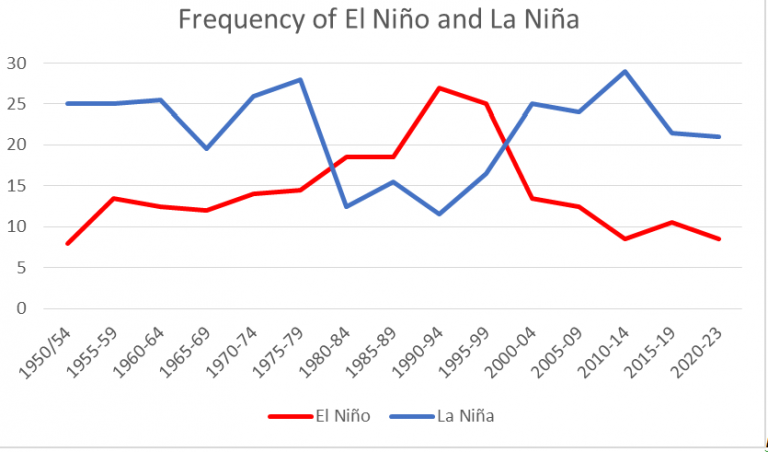
We’ve had a La Niña for nearly three years. But now it has officially ended, and ENSO has moved into its neutral phase, the “La Nada”.[1] The La Niña event lasted three winters in a row, something that has only occurred twice before in modern times: 1973–1976 and 1998–2001. Both of these followed in response to a very strong El Niño.

The La Niña that has now ended, on the other hand, came after the more neutral winter of 2019/20.

Figure 1. Number of months with each ENSO phase for five-year periods from 1950 – 2023

The number of months that we have had each ENSO phase in the last 74 years is shown in Figure 1. The La Niñas are more frequent than the El Niños. Interestingly, the opposite was true during the rapid warming we had from 1975 – 1999, when El Niños were more common. But then it reverts back again around 1998/99. Is there a pattern here?

It is established in climate science that the climate underwent a profound shift in 1976/77, related to the ocean currents.[2] In IPCC AR4, they write: “The 1976–1977 climate shift in the Pacific, associated with a phase change in the PDO from negative to positive, was associated with significant changes in ENSO evolution.” The Pacific Decadal Oscillation (PDO) shifted from a ‘cold’ to a ‘warm’ phase during these two years.[3] The ENSO also became dominated by the El Niño phase, which is characterized by warmer temperatures.[4] These changes affected the global climate, and a rapid warming began.

But what happened in the years just before 2000? As seen in Figure 1, ENSO reverts to being dominated by the ‘colder’ La Niña at that time.

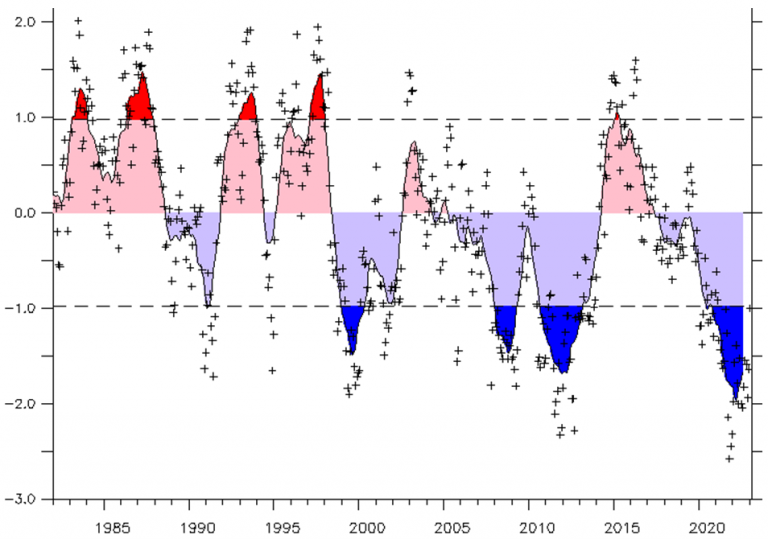
Figure 2. The PDO index according to NOAA/ESRL.

Interestingly, the PDO also reverts to its cold phase in 1998–1999.

Are we seeing a shift to a colder phase in the climate here?

What Is A 1000 Year Flood?

by P. Homewood, Apr 18, 2023 in NotaLotofPeopleKnowThat


We’ve all heard the terminology. An extreme event happens — a flood or heat wave — and soon after it is characterized as a “1,000-year event” (or it doesn’t have to be 1,000, it could be any number). This week I watched one of the world’s most visible climate scientists, Michael E. Mann, go on national TV and in process show that he had no idea what the concept actually means.

Let’s start by correcting that climate scientist who expressed a popular misconception (about which climate scientists should know better). A 1,000-year flood does not refer to a level of flooding that comes around every 1,000 years.

Study Claims Ice Sheet Melt After Last Ice Age Faster Than Expected, Sans SUV

by E. Utter, Apt 11, 2023 in ClimateChangeDispatch


According to a recently released study, at the end of the last ice age, parts of an enormous ice sheet covering Eurasia retreated up to 2,000 feet per day.

That rate is the fastest measured to date, far exceeding what scientists previously believed to be the upper limits for ice sheet retreat. [emphasis, links added]

In the new study, lead author Christine Batchelor and her colleagues analyzed former beds of two major ice streams across the Norwegian continental ice shelf dating back 15,000 to 19,000 years ago.

Using ship-borne imagery, the team then calculated the rates of retreat by studying patterns of wavelike ridges along the seafloor.

They hypothesized that the “orderly” ridge patterns they observed may have been created as the front of the glacier bounced on the seafloor from daily tides.

Call me a skeptic, but this doesn’t sound to me like “settled science.”

Nonetheless, Batchelor and crew think the finding may shed light on how quickly ice in Greenland and Antarctica might melt — and raise global sea levels — in a warming world.

Batchelor stated: “If temperatures continue to rise, then we might have the ice being melted and thinned from above as well as from below, so that could kind of end up with a scenario that looks more similar to what we had [off] Norway after the last glaciation.”

According to a story in The Washington Post, Eric Rignot, a glaciologist who was not involved in the study, opined on it anyway, stating via email:

This is not a model. This is real observation. And it is frankly scary. Even to me.” (Cue the voice of Elmer Fudd. “Yes, it is vewy, vewy, scawy, Rignot.” Not.

The only thing the study proves is that the Earth warmed quickly and dramatically eons agowithout any possible help from man.

Antarctic Ice Cap To Grow Despite Global Warming–New Study

by P. Homewood, Mar 29, 2023 in NotaLotofPeopleKnowThat


This study seems to have gone under the radar last year:

https://doaj.org/article/df360f90269148b181055b409cd38204

So in short, under high emission scenarios, they reckon that the Antarctic ice cap will actually grow, with heavier snowfall more than offsetting glacial melt, leading to lower sea levels. And even under lower emissions the rate of melt will still be lower than currently.

Indeed according to scientists like Jay Zwally, the Antarctic ice cap has actually been growing in recent decades, for precisely this reason.

Climate Doomsayers Are Always Wrong — But Cling To Their Anti-Human Faith

by D. MCCarthy, Mar 28, 2023 in ClilmateChangeDispatch


What does it take to avert the end of the world?

For most of human history, this has been a question for religion. And the answer has usually been that human beings must repent of their sins.

They must surrender some comfort and luxury to appease angry gods. In primitive times, worshippers might sacrifice a bull — or even a human being. [emphasis, links added]

Today climate science provides an end-times prophecy that works in much the same way as the religious apocalypticism of old.

Religion enchants the world, lending spiritual significance to every part of life. Climate change makes everything from charging your iPhone to skipping beef for dinner a potentially salvific act.

Cattle once again have to be sacrificed — they emit too much methane and CO2.

And the dietary laws that climate science prescribes are as exacting as those of any religion. Every day is a fast day when you subsist on tofu and insect protein.

Purity and ritual cleanliness are religious concepts that find a remarkable parallel in the way of life that climate science promotes.

By default, Apple’s phones are now set to “clean energy charging” mode, which takes longer to recharge the battery but contributes in however small a way to saving us from the weather.

Well-educated liberals laugh when a televangelist claims a hurricane is God’s punishment for America’s acceptance of homosexuality.

Yet liberals also believe the weather is a moral force, punishing Americans for the sins of capitalism.

Inventing The Apocalypse: Climate Doomsday Predictions Haven’t Aged Well

by B. Adams, Mar 27, 2023 in ClimateChangeDispatch


….


….


Climate scientists and alarmists have prophesied the planet’s imminent demise nearly every year now dating back to at least the end of the Second World War.

“We don’t have 12 years to save the climate. We have 14 months,” the now-defunct ThinkProgress predicted 43 months ago.

Former French prime minister Laurent Fabius warned 3,239 days ago that the international community had only “500 days to avoid climate chaos.

Earlier, in 2009, Gordon Brown, the U.K.’s prime minister at the time, said we had “fewer than fifty days to save our planet from catastrophe.

Also in 2009, former vice president Al Gore declared that “there is a 75% chance that the entire north polar ice cap, during some of the summer months, could be completely ice-free within the next five to seven years.

In 2013, mid-melt, the Guardian ran the following headline: “US Navy predicts summer ice-free Arctic by 2016.

The ice is still there.

NASA Scientist: We’re Toast,” reads the headline of an Associated Press report from 2008.

In 2007, the IPCC predicted the Himalayan glaciers would disappear by 2035. The U.N.’s chief climate science body retracted the claim in 2010, explaining the prediction wasn’t based on any peer-reviewed data, but on a media interview with a scientist conducted in 1999.

In 2006, Gore claimed that unless world leaders took “drastic measures” to reduce greenhouse-gas emissions, Earth would surpass the “point of no return” in ten years — a “true planetary emergency,” he called it.

The year 2016 came and went, and now we’re being told the early 2030s are the real point of no return.

The Guardian, citing a “secret report,” warned in 2004 that “major European cities will be sunk beneath rising seas as Britain is plunged into a ‘Siberian’ climate by 2020.

The year 2022 was the U.K.’s warmest since they started keeping records in 1884. The heat was, of course, blamed on climate change.

New Study: Atmospheric CO2 Residence Time Is Only 5 Years – Too Short To ‘Affect The Climate’

by P. Stallinga, Mar 23, 2023 in NoTricksZone

Since the early 1990s the conventional assumption, aligned with modeling, has been that a molecule of human CO2 emission stays in the atmosphere –  its residence time – for centuries. This fits the anthropogenic global warming (AGW) narrative. But empirical evidence contradicts these model-based assumptions. Residence time is closer to 5-10 years.

In Table 1 of a new study, Stallinga (2023) compiled a list of 36 published estimates of CO2 residence time spanning the decades 1957-1992. All of these scientists determined CO2’s atmospheric residence time is about 5 to 10 years or less.

Of course, these were the pre-IPCC decades in climate research, when “the science” was pursued independent of government interference. For example, it was still acceptable in the 1950s to early 1990s for scientists to publish actual ice core measurements showing the atmospheric CO2 content ranged up to 700 ppm, even 2,450 ppm, in the ice sheets and glaciers examined throughout the last 10,000 years (Jaworowski et al., 1992).

An actual residence time that is 20 to 40 times shorter in duration than what an AGW modeled thought experiments allow undermines the dangerous greenhouse gas accumulation talking points, as “if the residence time is below 30 years, injections of CO2 in the atmosphere would, just as water, not affect the climate” (Stallinga, 2023).

In addition to compiling an exhaustive list of past estimates supporting a 5-10 year residence time, Dr. Stallinga cites the evidence from atomic bomb tests, the lack of any atmospheric CO2 effect from the pandemic lockdowns and associated sharp drop in  emissions, and the lead-lag relationship CO2 emission has with temperature as evidence supporting the once commonly-accepted conclusion that CO2 residence is closer to 5 years, not centuries.

The 2022 Hurricane Season

by P. Homewood (pdf), Feb 2023 in GWPF


Contents

About the author iii Executive summary v

  1. Introduction 1
  2. Observational methodologies 1
  3. US landfalling hurricanes 3
  4. Atlantic hurricanes 5
  5. Global trends 7
  6. What do the IPCC say? 8

Notes
About the Global Warming Policy Foundation 10

Executive summary

It is widely believed that hurricanes are getting worse as a consequence of climate change. This belief is fuelled by the media and some politicians, particularly when a bad storm occurs. This be- lief is reinforced because the damage caused by hurricanes is much greater nowadays, thanks to increasing populations in vulnerable coastal areas and greater wealth more generally.

But is this belief correct, or is it a misconception? This study has carefully analysed official data and assessments by hurricane scientists, and finds:

• 2021 and 2022 recorded the lowest number of both hurricanes and major hurricanes glob- ally for any two year period since 1980.

• The apparent long-term increase in the number of hurricanes since the 19th century has been due to changes in observational practices over the years, rather than a real increase.

• Data show no long-term trends in US landfalling hurricanes since the mid-19th century, when systematic records began, either in terms of frequency or intensity.

• Similarly, after allowing for the fact that many hurricanes were not spotted prior to the sat- ellite era, there are no such trends in Atlantic hurricanes either.

  • Globally there are also no trends in hurricanes since reliable records began in the 1970s.
  • Evidence is also presented that wind speeds of the most powerful hurricanes may now be overestimated in comparison to pre-satellite era ones, because of changing methods of meas- urement.

• The increase in Atlantic hurricanes in the last fifty years is not part of a long-term trend, but is simply a recovery from a deep minimum in hurricane activity in the 1970s, associated with the Atlantic Multidecadal Oscillation.

These findings are in line with those of hurricane scientists generally, as well as official bodies such as NOAA and the IPCC.

Do European tree ring analyses indicate unusual recent hydroclimate?

by F. Bosse  & N. Lewis, Feb 23, 2023 in WUWT


Not really.

A recent paper (M. B. Freund et al 2023, MBF23 thereafter) in “Nature communication earth and environment” investigates the variability of the summer drought events since 1600. It uses the method of “stable isotope analyses C13/O18” to extend the “Standardised Precipitation-Evapotranspiration Index (SPEI) from 1950 to now back to 1600.

The paper describes and uses a multi proxy network over large parts of Europe (see Fig. 1 of MBF23) to reconstruct the history of summer droughts for a longer historic period. It finds interesting results about the dependency of those events on volcanos and solar forcing. It’s a worthwhile read and we were interested in whether the headline title is justified and likewise this claim in the Abstract:

“We show that the recent European summer drought (2015–2018) is highly unusual in a multi-century context…”

Thanks to the authors the used SPEI reconstruction annual data are available, so we were able to perform calculations to check these assertions.

An apparent first “confirmation” of the headline title of the paper appears in Figure 3a in MBH23:

Fig.1: A reproduction of Fig. 3a of MBH23. Annual European mean SPEI-data in blue/red, the low pass filter output is shown in black.

Abrupt episode of mid-Cretaceous ocean acidification triggered by massive volcanism

by Jones et al., Jan 2023 in NatureGeoscience


Abtsract

Large-igneous-province volcanic activity during the mid-Cretaceous triggered a global-scale episode of reduced marine oxygen levels known as Oceanic Anoxic Event 2 approximately 94.5 million years ago. It has been hypothesized that this geologically rapid degassing of volcanic carbon dioxide altered seawater carbonate chemistry, affecting marine ecosystems, geochemical cycles and sedimentation. Here we report on two sites drilled by the International Ocean Discovery Program offshore of southwest Australia that exhibit clear evidence for suppressed pelagic carbonate sedimentation in the form of a stratigraphic interval barren of carbonate minerals, recording ocean acidification during the event. We then use the osmium isotopic composition of bulk sediments to directly link this protracted ~600 kyr shoaling of the marine calcite compensation depth to the onset of volcanic activity. This decrease in marine pH was prolonged by biogeochemical feedbacks in highly productive regions where elevated heterotrophic respiration added carbon dioxide to the water column. A compilation of mid-Cretaceous marine stratigraphic records reveals a contemporaneous decrease of sedimentary carbonate content at continental slope sites globally. Thus, we contend that changes in marine carbonate chemistry are a primary ecological stress and important consequence of rapid emission of carbon dioxide during many large-igneous-province eruptions in the geologic past.