by Dr Roy Spencer, July 3, 2020 in GlobalWarming
For the last 10 years I have consulted for grain growing interests, providing information about past and potential future trends in growing season weather that might impact crop yields. Their primary interest is the U.S. corn belt, particularly the 12 Midwest states (Iowa, Illinois, Indiana, Ohio, Kansas, Nebraska, Missouri, Oklahoma, the Dakotas, Minnesota, and Michigan) which produce most of the U.S. corn and soybean crop.
Contrary to popular perception, the U.S. Midwest has seen little long-term summer warming. For precipitation, the slight drying predicted by climate models in response to human greenhouse gas emissions has not occurred; if anything, precipitation has increased. Corn yield trends continue on a technologically-driven upward trajectory, totally obscuring any potential negative impact of “climate change”.
What Period of Time Should We Examine to Test Global Warming Claims?
Based upon the observations, “global warming” did not really begin until the late 1970s. Prior to that time, anthropogenic greenhouse gas emissions had not yet increased by much at all, and natural climate variability dominated the observational record (and some say it still does).
Furthermore, uncertainties regarding the cooling effects of sulfate aerosol pollution make any model predictions before the 1970s-80s suspect since modelers simply adjusted the aerosol cooling effect in their models to match the temperature observations, which showed little if any warming before that time which could be reasonably attributed to greenhouse gas emissions.
This is why I am emphasizing the last 50 years (1970-2019)…this is the period during which we should have seen the strongest warming, and as greenhouse gas emissions continue to increase, it is the period of most interest to help determine just how much faith we should put into model predictions for changes in national energy policies. In other words, quantitative testing of greenhouse warming theory should be during a period when the signal of that warming is expected to be the greatest.
50 Years of Predictions vs. Observations
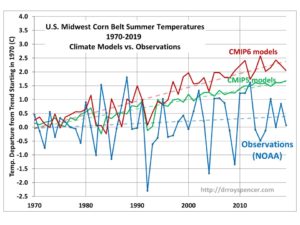
Now that the new CMIP6 climate model experiment data are becoming available, we can begin to get some idea of how those models are shaping up against observations and the previous (CMIP5) model predictions. The following analysis includes the available model out put at the KNMI Climate Explorer website. The temperature observations come from the statewide data at NOAA’s Climate at a Glance website.
For the Midwest U.S. in the summer (June-July-August) we see that there has been almost no statistically significant warming in the last 50 years, whereas the CMIP6 models appear to be producing even more warming than the CMIP5 models did.
…