Archives par mot-clé : Temperature

A New 1787-2005 Temperature Reconstruction Determines The Coldest 50-Year Period Was 1940-1993

by K. Richard, Mar 4, 2024 in NoTricksZone


The warmest 50-year period in northeastern China occurred from 1844-1893.

Li et al., 2024

“Compared with single years, in general, high or low temperatures that persist for many years will more significantly affect the growth of trees [30]. When we defined years with T12-1 ≥ −10.73 °C (Mean + 1σ) and T12-1 ≤ −12.61 °C (Mean − 1σ) as extreme warm years and cold years, respectively, the reconstruction for the period of 1787–2005 contained 31 cold years and 36 warm years (Table 4). The extreme cold/warm events lasting for three or more consecutive years were discovered in 1965–1967 and 1976–1978/1791–1798, 1844–1849 and 1889–1891. An 11-year smoothing average of the reconstructed T12-1 series was performed to reveal multi-year and interdecadal variations and to detect the several prolonged cold and warm periods (Figure 5d). After smoothing with an 11-yr moving average, cold periods occurred in 1822–1830 (mean T12-1 = −12.7 °C) and 1957–1970 (mean T12-1 = −12.7 °C), while a warm period occurred in 1787–1793 (mean T12-1 = −10.4 °C) (Figure 5d). Rapid and sustained cooling was observed in the reconstructed series in the years 1790–1826 (T12-1 range −10.3 °C to −12.8 °C, mean = −12.0 °C) and 1939–1969 (T12-1 range −11.6 °C to −12.7 °C, mean = −12.1 °C), where the rates of cooling were about 0.067 °C/year and 0.035 °C/year, respectively (Figure 5d). The two cooling events may be due to the decrease in solar activity [48,49,50]. Using a 50-year time scale, the highest temperature occurring during 1787–2005 was from 1844 to 1893 (T12-1 range −12.79 °C to −9.41 °C, mean = −11.15 °C), similar results were also obtained by Zhu et al. and Jiang et al., while the lowest temperature was from 1940–1993 (T12-1 range −13.57 °C to −10.26 °C, mean = −12.13 °C) (Figure 5d) [33].”

Warming Earth Has Changed U.S. Hardiness Zones

by  K. Hansen, March 4, 2024 in WUWT


Several times I have had readers at WUWT ask in comments:  “If the climate is changing, why haven’t the planting zone maps changed?”

Well, they have and they do.  The U.S. Department of Agriculture issues a new U.S.D.A. “Plant Hardiness Zone Map” periodically.  A new version of the map was just released on Nov. 15, 2023.  I became aware of it because my wife is an avid gardener and follows our local agricultural County Cooperative Extension news.

When she followed the link to the new Plant Hardiness map and checked our very local area, she was surprised to see that it had “warmed” here by 5°F.   Here is the bit of the page she was looking at:

She was a bit perplexed by this news, as we have been having not “hot” years but cooler years recently. It took me a minute to sort through it to see that the drop down was not clear on what temperature change they were talking about.  That temperature change elevated us one half a zone from zone 5b to zone 6a.


Claim: Global Warming is Reducing Maximum Temperatures in the Himalayas

by E. Worrall, Dec 15, 2023 in WUWT


Nature Geoscience volume 16, pages 1120–1127 (2023)Cite this article

Abstract

Understanding the response of Himalayan glaciers to global warming is vital because of their role as a water source for the Asian subcontinent. However, great uncertainties still exist on the climate drivers of past and present glacier changes across scales. Here, we analyse continuous hourly climate station data from a glacierized elevation (Pyramid station, Mount Everest) since 1994 together with other ground observations and climate reanalysis. We show that a decrease in maximum air temperature and precipitation occurred during the last three decades at Pyramid in response to global warming. Reanalysis data suggest a broader occurrence of this effect in the glacierized areas of the Himalaya. We hypothesize that the counterintuitive cooling is caused by enhanced sensible heat exchange and the associated increase in glacier katabatic wind, which draws cool air downward from higher elevations. The stronger katabatic winds have also lowered the elevation of local wind convergence, thereby diminishing precipitation in glacial areas and negatively affecting glacier mass balance. This local cooling may have partially preserved glaciers from melting and could help protect the periglacial environment.

Read more: https://www.nature.com/articles/s41561-023-01331-y

The maximum temperature trend may be cooling at -0.26C per decade at some stations, according to the study.

Applying Scale and Context to 2023’s “Record” High Temperatures

by D. Middleton, Oct 3, 2023 in WUWT


2023 has been a hot year… We have the makings of a super-El Niño and an unprecedented injection of water vapor into the upper atmosphere stacked on top of a general warming trend since 1978, if not since the nadir of the Little Ice Age. So, it should come as no surprise that we have seen satellite-era record high temperatures, this summer and early fall.

As a geologist, I always have to apply scale and context to everything.

Scale

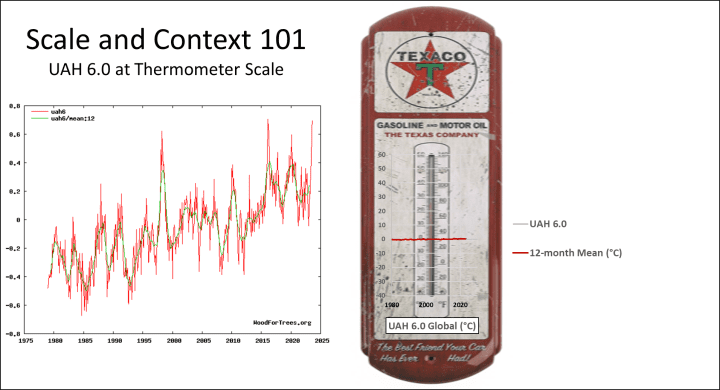
Temperature anomaly records are great tools. They are the only way to accurately describe how global temperatures are changing over time. However, they lack scale. They lack a frame of reference.

It is a common adage that when a geologist takes a photograph of a person, that person is simply there for scale. Other scale references include: camera lens covers (rendered obsolete by smart phones), quarters, rock hammers, spouses and action figures (on April Fools Day only). The key is to come up with a reference that is relatable. And what temperature reference is more relatable than a thermometer?

Figure 1. UAH 6.0 from WoodForTrees (l), UAH 6.0 at gas station thermometer scale.

The Holocene CO2 Dilemma

by R. Hannon, June 2023, in WUWT


This post evaluates the relationship of global CO2 with regional temperature trends during the Holocene interglacial period. Ice core records show that CO2 is strongly coupled with local Antarctic temperature and slightly lags temperature over the past 800,000 years (Luthi, 2008). Whereas the emphasis has been on CO2 and temperature lags/leads, this study focuses on Holocene millennium trends in different latitude-bounded regions.

The Contrarian Antarctic

The Holocene is fortunate to have hundreds of proxy records analyzed by Marcott, 2013, and more recently Kaufman, 2020, to establish regional and global temperature trends. The Holocene interglacial occurs approximately during the past 11,000 years. In general, global temperature trends from proxy data show a Holocene Climatic Optimum (HCO) around 6000 to 8000 years ago and a subsequent cooling trend, the Neoglacial period, culminating in the Little Ice Age (LIA). The global mean temperature is comprised of regional trends that tend to have a concave down appearance during the Holocene shown in Figure 1a.

The exception is the Antarctic shown in red which has a concave up shape. The Antarctic reached an early Holocene Climatic Optimum between 9000 to 11000 years ago. While global and most regional temperatures were warming, Antarctic cooled to a minimum around 8000 years ago. While global and other regions show progressive cooling during the Neoglacial, the Antarctic was flat and erratic. This contrary Antarctic temperature behavior during the Holocene has also been noted by Andy May here.

Observations

Climate change is routinely claimed to be largely controlled by greenhouse gases, especially CO2. This was concluded, in part, by the strong relationship between CO2 from Antarctic ice core bubbles and local Antarctic temperature trends. While CO2 mimics Antarctic temperatures very well, ninety percent of Earth’s surface temperature trends do not demonstrate a positive correlation to CO2 during the Holocene. Arctic and Northern Hemisphere temperatures become cooler during increasing CO2 levels. Tropical proxy temperatures don’t seem to be influenced by CO2.

Model simulated temperatures which are strongly influenced by CO2 do not accurately history match Holocene global proxy temperatures and tend to largely reflect Antarctic trends. The fact that CO2 correlates well to Holocene temperatures for only the Antarctic, or <10% of our planet’s surface, yet CO2 is considered as the dominant influence on climate change is a scientific dilemma.

Download the bibliography here.

High sea surface temperature in North Atlantic

by Arctic News, Apr 22, 2023


SST World (60S-60N)

On April 20, 2023, sea surface temperatures (between 60°South and 60°North) had been at 21°C or higher for as many as 32 days. Such temperatures are unprecedented in the NOAA record that goes back to 1981.


On April 4, the sea surface temperature in 2023 (black line) was as much as 0.3°C higher than in 2022 (orange line) and we’re only just entering the upcoming El Niño.


SST North Atlantic

The situation is especially critical in the North Atlantic. Vast amounts of ocean heat in the North Atlantic are moving toward the Arctic, threatening to cause rapid melting of Arctic sea ice and thawing of permafrost. Last year, North Atlantic sea surface temperatures reached a record high of 24.9°C in early September and, as illustrated by the image below, the North Atlantic sea surface temperature on April 20 was as much as 0.5°C higher in 2023 (black) than in 2022 (orange).

As we’re moving into the upcoming El Niño, the Arctic Ocean can be expected to receive more and more heat over the next few years, i.e. more heat from direct sunlight, more heat from rivers, more heat from heatwaves and more ocean heat from the Atlantic Ocean and the Pacific Ocean.

NOAA Study: Atmosphere Warming At Half The Rate Predicted By Climate Models

by R. MCKitrick, Apr 13, 2023 in ClimateChangeDispatch


An important new study on climate change came out recently. I’m not talking about the Intergovernmental Panel on Climate Change (IPCC) Synthesis Report with its nonsensical headline, “Urgent climate action can secure a liveable future for all.”

No, that’s just meaningless sloganeering proving yet again how far the IPCC has departed from its original mission of providing objective scientific assessments. [emphasis, links added]

I’m referring instead to a new paper in the Journal of Geophysical Research-Atmospheres by a group of scientists at the U.S. National Oceanic and Atmospheric Administration (NOAA) headed by Cheng-Zhi Zou, which presents a new satellite-derived temperature record for the global troposphere (the atmospheric layer from one kilometer up to about 10 km altitude).

The troposphere climate record has been heavily debated for two reasons. First, it’s where climate models say the effect of warming due to greenhouse gases (GHGs) will be the strongest, especially in the mid-troposphere.

And since that layer is not affected by urbanization or other changes to the land surface, it’s a good place to observe a clean signal of the effect of GHGs.

Since the 1990s the records from both weather satellites and weather balloons have shown that climate models predict too much warming.

In a 2020 paper, John Christy of the University of Alabama-Huntsville (UAH) and I examined the outputs of the 38 newest climate models and compared their global tropospheric warming rates from 1979 to 2014 against observations from satellites and weather balloons.

All 38 exhibited too much warming, and in most cases, the differences were statistically significant. We argued that this points to a structural error in climate models where they respond too strongly to GHGs.

But, and this is the second point of controversy, there have also been challenges to the observational record.

Classifying Land Temperature Stations as Either “Urban” or “Rural” in UHI Studies Proves Nothing about Spurious Temperature Trends

by Dr. Roy Spencer, Apr 5, 2023 in WUWT


From Dr. Roy Spencer’s Global Warming Blog

by Roy W. Spencer, Ph. D.

As I spend more time working on a research project, the more time I have to reflect on things that others have simply assumed to be true. And in the process I sometimes have an epiphany than clarifies my thinking on a subject.

As I continue to investigate how to quantify urban heat island (UHI) effects for the purpose of determining the extent to which land surface temperature trends have been spuriously inflated by urbanization effects, there is one recurring theme I find has not been handled well in previously published papers on the subject. I’ve mentioned it before, but it’s so important, it deserves its own (brief) blog post.

It has to do with the common assumption that “urban” thermometer sites experience spurious warming over time, while “rural” sites do not.

Obviously, at any given point in time urban environments are warmer than rural environments, especially at night. And urbanization has increased around temperature monitoring sites over the last 50 to 100 years (and longer). Yet, a number of studies over the years have curiously found that urban and rural sites have very similar temperature trends. This has led investigators to conclude that temperature datasets such as the Global Historical Climate Network (GHCN), especially after “homogenization”, is largely free of spurious warming effects from urbanization.

But the conclusion is wrong…all it shows is that temperature trends between rural and urban sites are similar… not that those trends are unaffected by urbanization effects.

Instead, studies have demonstrated that the greatest rate of warming as population increases is for nearly-rural sites, not urban. The one-fourth power relationship found by Oke (1973) and others (and which I am also finding in GHCN data in the summer) means that a population density increase from 1 to 10 persons per sq. km (both “rural”) produces more warming than an urban site going from 1,000 to 1,700 persons per sq. km.

Thus, “rural” sites cannot be assumed to be immune to spurious warming from urbanization. This means that studies that have compared “rural” to “urban” temperature trends haven’t really proved anything.

The mistake people have made is to assume that just because urban locations are warmer than rural locations at any given time that they then have a much larger spurious warming impact on trends over timeThat is simply not true.

Scientists Say A 6°C Warmer-Than-Today Arctic Is ‘Optimal’ For Thermophile Species

by K. Richard, Apr 6, 2023 in NoTricksZone


Back in the Early Holocene, when CO2 levels were said to be ~255 ppm, Arctic Svalbard was warm enough to accommodate abundant numbers of thermophiles, or warmth-demanding species. Only “remnants” of these species and their habitat exist in today’s much-colder Arctic.

With the exception of a few centuries in recent millennia, today’s Svalbard (Arctic) is the most glaciated it has been in the last 10,000 years (see the blue trend line in the below chart from Brožová et al., 2023).


This region is today about 6°C colder than it was during the early Holocene (~10,000 to 8,000 years ago), a climatic period scientists characterize as an optimum, or “most favorable,” for a “rich species pool” of thermophiles.

The sea surface temperatures (SSTs) in the western Barents Sea were as warm as 13°C and “sea ice-free during most of the mid-Holocene” (Łącka et al., 2019). In contrast, today’s SST in this region are as cold as they were during the last glacial (2-4°C), when CO2 hovered near 200 ppm. Rapid double-digit SST fluctuations, varying from 3 to 13°C, have been ongoing throughout the Holocene.

Greenland Temperatures 2020

by P. Homewood, June 12, 2021 in NotaLotofPeopleKnowThat


I mentioned a year ago that the reason for the deficit in ice mass increase during the winter and spring of 2020 was sustained cold and dry weather. (Conversely milder weather tends to bring snow). I also reported how the summer melt began much later than normal.

The Danish Meteorological Institute (DMI) have now published the official Greenland temperature for last year, bearing this out and showing how cold it really was:


image

Greenland Surface Mass Ice Balance 2019/20

http://polarportal.dk/en/greenland/surface-conditions/

Real-World Observation: Increasing CO2 By 7,000 ppm Has A 0.3°C Temperature Differential

by K. Richard, Mar 30, 2023 in NoTricksZone


Surface air CO2 concentrations vary by 100s to 1,000s of ppm within a span of hours to days or weeks across the natural world. The observational evidence suggests these variations are neither driving or even causing temperature changes.

According to recent field research (Mungai, 2021) conducted in Kenya, the observed CO2 concentrations in the atmospheric air above mofette springs (8) averages 3,400-4,800 ppm. Interestingly, the temperatures associated with these high CO2 levels are “relatively low” or “cold” (~21.5 to 29.5°C) compared to ambient temperatures at other nearby sites with ~400 ppm CO2.
 
The study also shows that when CO2 increases from 5,253 ppm in wet season to 12,138 ppm in dry season over a mofette springs site, there is only a 0.3°C temperature differential (23.4°C vs. 23.1°C) associated with this >7,000 ppm CO2 change. The sensitivity of the surface air temperature to these extremely high CO2 variations would appear to be vanishingly small – or non-existent.

Warming Globe? Then Why Haven’t Winters In Tokyo Been Warming Since the 1980s?

by P. Gosselin, March 1, 2023 in NoTricksZone


The December 1 to February 28 so-called meteorological winter has just ended and the latest data for the mean winter temperature are available for Tokyo and its island Hachijō-jima.

Tokyo winters have been cooling since 1984

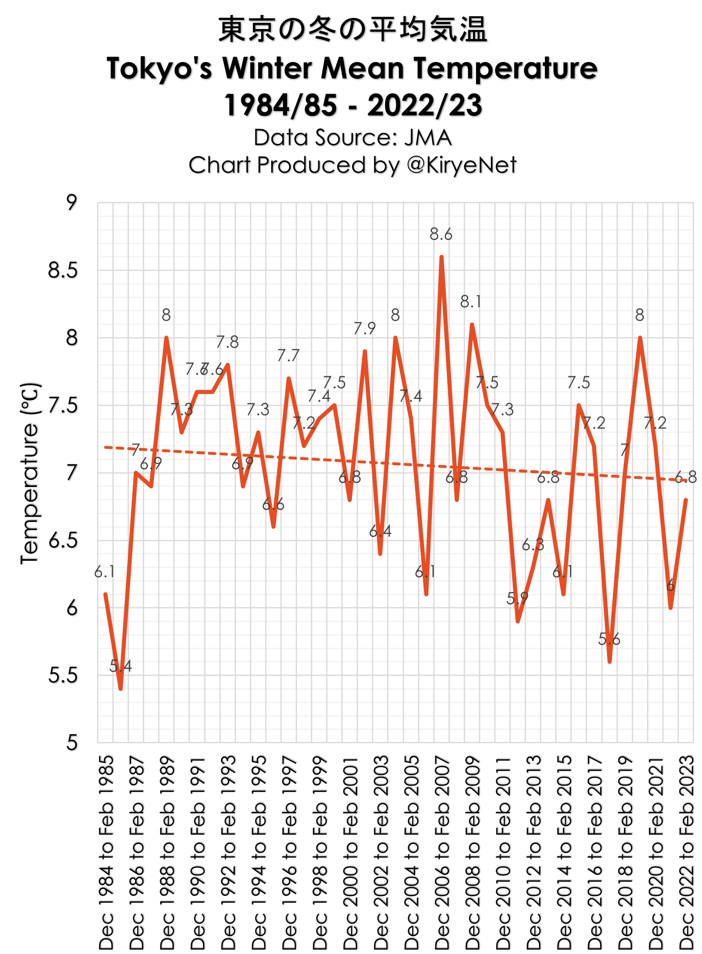
With all the news about global warming, surely the decades long winter-trend for the city of Tokyo must be one of strong warming. Yet, looking at the mean DJF winter temperature trend for Tokyo going back 39 years using the untampered data from the Japan Meteorological Agency (JMA), we see a trend that has to surprise the global warming bedwetting dolts:

Data source: JMA

As the chart shows, instead of warming, winters in Tokyo have been cooling (modestly) since the global warming scare began in the 1980s. The average of the last 10 years have definitely been colder than the two preceding ten-year periods. Citizens in Tokyo who have been hearing warming doom for decades have in fact not experienced it. Where’s the warming?

….

Greenland Temperatures Rose 1°C In 1994 … Since Then They Have Been ‘Relatively Constant’

by K. Richard, Feb 27, 2023 in NoTricksZone


A warming event that spans only one year, with decades of stable temperatures before and after, would not appear to align with rapidly rising human CO2 emissions or a gradually rising atmospheric CO2 concentration.

From 1958 to 2020, as CO2 rose from 320 ppm to 410 ppm, Greenland had a warming period of 1°C that lasted one year – 1994. Over the next 26 years (1994-2020) and spanning the years 1958 to 1993, there have been “relatively constant” temperatures across Greenland (Zhang et al., 2022).

These temperature trends appear to align much better with phases of the North Atlantic Oscillation (NAO), Greenland blocking indexes (GBI), and volcanism better than they do with any anthropogenic causal agents.

Mid-Pleistocene transition in glacial cycles explained by declining CO2 and regolith removal

by Willeit et al., 2019 in ScienceAdvances

Abstract

Variations in Earth’s orbit pace the glacial-interglacial cycles of the Quaternary, but the mechanisms that transform regional and seasonal variations in solar insolation into glacial-interglacial cycles are still elusive. Here, we present transient simulations of coevolution of climate, ice sheets, and carbon cycle over the past 3 million years. We show that a gradual lowering of atmospheric CO2 and regolith removal are essential to reproduce the evolution of climate variability over the Quaternary. The long-term CO2 decrease leads to the initiation of Northern Hemisphere glaciation and an increase in the amplitude of glacial-interglacial variations, while the combined effect of CO2 decline and regolith removal controls the timing of the transition from a 41,000- to 100,000-year world. Our results suggest that the current CO2 concentration is unprecedented over the past 3 million years ant that global temperature never exceeded the preindustrial value by more than 2°C during the Quaternary.

Europe’s climate warming at twice rate of global average, claims WMO

by P. Homewood, Nov 4, 2022 in NotaLotofPeopleKnowThat


Temperatures in Europe have increased at more than twice the global average in the last 30 years, according to a report from the World Meteorological Organization (WMO).

The effects of this warming are already being seen, with droughts, wildfires and ice melts taking place across the continent. The European State of the Climate report, produced with the EU’s Copernicus service, warns that as the warming trend continues, exceptional heat, wildfires, floods and other climate breakdown outcomes will affect society, economies and ecosystems.

From 1991 to 2021, temperatures in Europe have warmed at an average rate of about 0.5C a decade. This has had physical results: Alpine glaciers lost 30 metres in ice thickness between 1997 and 2021, while the Greenland ice sheet has also been melting, contributing to sea level rise. In summer 2021, Greenland had its first ever recorded rainfall at its highest point, Summit station.

https://www.theguardian.com/environment/2022/nov/02/europes-climate-warming-at-twice-rate-of-global-average-says-report

The WMO is of course another UN organisation, so obviously cannot be trusted. Neither can any of its sources of data, such as NOAA, GISS and Berkeley Earth, which are based around homogenised data.

But what do we know about recent climate trends in Europe?

Tokyo Midsummer Hasn’t Warmed In Decades. And: The Missing Hurricanes”.

by Kyrie, Aug 3, 2022 in NoTricksZone


Continuously increasing CO2 emissions into the atmosphere from the burning of fossil fuels is supposed to be causing warming all over the globe right now, so we should be seeing it in most of the trends.

But often we don’t. The globe, in fact, has cooled somewhat since the El Nino of 2015/16. The media refuse to report that.

One example of no warming is the midsummer mean for Tokyo and its rural Hachijojima island in the Pacific.

Tokyo

Looking at the July mean temperature trend for Tokyo itself, using data from the Japan Meteorological Agency (JMA), and not the adjusted datasets from NASA, we have the following:

New Study: 96% Of U.S. Climate Data Is Corrupted

by Heartland Institute, July 28, 2022  in ClimaterChangeDispatch


A new study, Corrupted Climate Stations: The Official U.S. Surface Temperature Record Remains Fatally Flawed, finds approximately 96 percent of U.S. temperature stations used to measure climate change fail to meet what the National Oceanic and Atmospheric Administration (NOAA) considers to be “acceptable” and uncorrupted placement by its own published standards. [bold, links added]

The report, published by The Heartland Institute, was compiled via satellite and in-person survey visits to NOAA weather stations that contribute to the “official” land temperature data in the United States.

The research shows that 96% of these stations are corrupted by localized effects of urbanization – producing heat bias because of their close proximity to asphalt, machinery, and other heat-producing, heat-trapping, or heat-accentuating objects.

Placing temperature stations in such locations violates NOAA’s own published standards (see section 3.1 at this link) and strongly undermines the legitimacy and the magnitude of the official consensus on long-term climate warming trends in the United States.

“With a 96 percent warm bias in U.S. temperature measurements, it is impossible to use any statistical methods to derive an accurate climate trend for the U.S.,” said Heartland Institute Senior Fellow Anthony Watts, the director of the study.

Lennart Bengtsson: Global climate change and its relevance for a global energy policy.

by H. von Storch, March 12, 2013 in DieKlimazwiebel


The relation between temperature and greenhouse gases in its very simplistic form has been known since the second half of the 19thcentury. The effect of the greenhouse gases can be seen as a warm overcoat preventing the surface in radiating away the heat to space. However, the warming is a complex process incorporating the dynamics of atmospheric and ocean flows and interactions of the many components of what is now called the Earth’s system. This includes in addition to the atmosphere, the oceans, the land surfaces and the land ices. Its study requires advanced computer models and other tools for its analysis and understanding.  It also requires accurate observations for validation and monitoring as well as special measurements for the development of many crucial aspects of the models. It is in fact an immensely complex undertaking that is virtually impossible to explain to the public in a readily understandable way. This has lead to a tendency towards oversimplification that has contributed more to confusion than to a thorough understanding. However, because of the strong public interest we are now facing a dilemma as the public and the political community have become too much involved in the climate change debate influencing the actual science and this not necessarily in a positive way as it implies an arbitrary selection of priorities and preferential issues.


Natural processes drive climate and practically all kinds of extreme weather have always been part of the climate and are practically unrelated to the modest warming we so far have had. The effect of increasing greenhouse gases is a slow but relentless process that will have to be dealt with but will require more time and better insight in key processes.Some events are seen as very dramatic as the reduced Arctic summer ice, others, even more puzzling, such as the surprising lack of warming in the tropical troposphere is hardly discussed.

The problem is that the global warming is mainly caused by the emission of carbon dioxide and thus directly related to energy production by fossil fuels that has dominated and still dominates the energy production by more than 80%. To significantly reduce or eliminate fossil fuel is not feasible on a time-scale shorter than several decades, as it requires fundamental technical breakthrough in energy generation or alternatively a major change in our life stile. As the second alternative is hardly possible to achieve in a world with mostly open societies, it is obvious that the world community is facing a gigantic challenge. Additionally many parts of the world are suffering because of a lack of suitable energy and the need is further underpinned by the fact that the world’s population will increase by another two billion humans in the next three decades.

Some comments on the present situation

New Study Affirms Temperatures Determine Greenhouse Gas Forcing Trends, Not The Other Way Around

by Singh H  & Polvani L, Jun 30, 2022 in NoTricksZone


CO2 and water vapor greenhouse effect impacts are not independent climate forcings . A new study affirms the “variance in the radiance in these channels is primarily controlled by…temperature” and “atmospheric absorption is strongly saturated in these [CO2, water vapor] channels”.

It has previously been established that greenhouse gas (water vapor, CO2) forcing “cannot be considered an independent component of the surface energy budget” because “anomalies in the downward longwave flux at the surface primarily arise as a consequence of surface temperature anomalies, rather than being the cause of those anomalies” (Singh and Polvani, 2020, Zeppetello et al., 2019).

Image Source: Singh and Polvani, 2020, Zeppetello et al., 2019

Feldman et al. (2015) admit they had to “construct” model-based spectra to simulate a CO2 signal in their seminal paper purporting to show CO2 changes cause temperature changes. This is because the temperature and water vapor levels primarily determine the overall longwave forcing (clear-sky) trends.

New Study Suggests The Early Holocene’s Baltic Sea Temperatures Were 5-11°C Warmer Than Present

by Weiss et al., 2022 in NoTricksZone


Baltic Sea surface temperatures may have reached 24°C 7,200 years ago compared to the current 12.7°C.

A new study (Weiss et al., 2022) indicates Baltic Sea regional surface temperatures ranged between 21-24°C from ~5.7 to 7.7 ka (thousand years ago). This period is referred to as the Baltic’s Holocene Thermal Maximum.

Temperatures dipped to 17.2°C at 1.373 ka. (The time span ranging from 0.0 ka to 3 ka is referred to in the study as the Modern Baltic, or M.B.)

The current (0.0 ka) surface temperature for the Baltic S is 12.7°C. This temperature is more than 11°C colder than the Baltic’s temperatures at 7.2 ka.

Evidence that Clouds Actively Regulate the Temperature

by W. Eschenbach, Oct 6, 2013 in WUWT


I have put forth the idea for some time now that one of the main climate thermoregulatory mechanisms is a temperature-controlled sharp increase in albedo in the tropical regions. I have explained that this occurs in a stepwise fashion when cumulus clouds first emerge, and that the albedo is further increased when some of the cumulus clouds evolve into thunderstorms.

I’ve demonstrated this with actual observations in a couple of ways. I first showed it by means of average photographs of the “view from the sun” here. I’ve also shown this occurring on a daily basis in the TAO data. So I thought, I should look in the CERES data for evidence of this putative phenomenon that I claim occurs, whereby the albedo is actively controlling the thermal input to the climate system.

Mostly, this thermoregulation appears to be happening over the ocean. And I generally dislike averages, I avoid them when I can.  So … I had the idea of making a scatterplot of the total amount of reflected solar energy, versus the sea surface temperature, on a gridcell-by-gridcell basis. No averaging required. I thought well, if I’m correct, I should see the increased reflection of solar energy required by my hypothesis in the scatterplots. Figure 1 shows those results for four individual months in one meteorological year. (The year-to-year variations are surprisingly small, so these months are quite representative.)

Climate Change in the Early Holocene

by University of Oxford, Jan 27, 2022 in WUWT

Radiocarbon dating from a prehistoric cemetery in Northern Russia reveals human stress caused by a global cooling event 8,200 years ago Early hunter gatherers developed more complex social systems and, unusually, a large cemetery when faced by climate

Peer-Reviewed Publication


16:00 (GMT), Thursday 27 January 2022

Climate change in the Early Holocene

  • Radiocarbon dating from a prehistoric cemetery in Northern Russia reveals human stress caused by a global cooling event 8,200 years ago
  • Early hunter gatherers developed more complex social systems and, unusually, a large cemetery when faced by climate change

New insight into how our early ancestors dealt with major shifts in climate is revealed in research,  published today [27 Jan] in Nature Ecology & Evolution, by an international team, led by Professor Rick Schulting from Oxford University’s School of Archaeology.

It reveals, new radiocarbon dates show the large Early Holocene cemetery of Yuzhniy Oleniy Ostrov, at Lake Onega, some 500 miles north of Moscow, previously thought to have been in use for many centuries, was, in fact, used for only one to two centuries. Moreover, this seems to be in response to a period of climate stress.

105 More Non-Global Warming/Non-Hockey Stick Temperature Records Added To The Database In 2021

by K. Richard, Jan 31, 2022 in NoTricksZone


Since 2019,there have been over 350 peer-reviewed scientific papers published showing no warming in the modern era and/or much warmer temperatures than today when CO2 levels ranged from 180 to 280 ppm (Holocene, Pleistocene).

Below is the link to the updated (now including 2021) database of non-hockey temperature records from locations across the world.

These hundreds of papers suggest a) Earth was multiple degrees warmer than today throughout much of the last 11,700 years (Holocene), and b) there has been nothing unusual about temperature changes in the modern era.

The first 8 papers on the 2021 list are shown below as samples.

Over 350 Non-Hockey Sticks (2019-2021)

Zhou et al., 2021  South China Sea ~4°C warmer SST during the Middle Holocene…1994-2004 coldest temperatures of the last 6000 years.

Using A Reference Period Outdated 30 Years, Germany’s DWD Weather Service Turns Cooling Into Warming

by Prof. F. Vahrenholt, Jan 8, 2022 in NoTricksZone


Globally, the deviation of the global mean temperature of the satellite-based measurements from the mean of period 1991-2020 rose slightly in December to 0.21 degrees Celsius. The mean temperature increase since satellite measurements began was 0.14 degrees Celsius per decade. The year 2021 was an average year compared to 2010 to 2020, with 0.134 degrees deviation from the thirty-year average. Six years since 2010 were warmer and 5 years were colder.

This is also true for Germany. But the German weather service gives a different impression

How the German DWD Weather Service turned cooling into warming in 2021  

In its press release on Germany’s weather in 2021, the German Weather Service writes: “The mean temperature [Germany] in 2021 was 9.1 degrees Celsius (°C), 0.9 degrees above the value of the internationally valid reference period 1961 to 1990. 2021 was thus the eleventh year in a row that was too warm.”

Why does the DWD use the internationally no longer valid 1961-1990 reference period? It writes itself elsewhere: “To record the climate and its changes, mean values are formed over a period of 30 years…With the end of the year 2020, the reference period for current climatological assessments was replaced by the 1991 to 2020 period.”

Fudging with the reference period

The DWD thus followed the World Meteorological Organization (WMO)recommendation. But in the press release, the DWD still prefers to use the old, outdated period. The 1991 to 202 0reference period differs from the one of 1961 to 1990 by 1.1 degrees. So the DWD should have written : “2021 was 9.1 degrees, 1.3 degrees cooler than 2020 and even -0.2 degrees Celsius below the average from 1991 to 2020. Since 1991 there have only been 9 years colder than 2021.”

But 0.9 degrees more and the eleventh year in a row that is too warm (compared to the colder period of 1961-1990) of course fits much better with the zeitgeist.

Read original in German at Die kalte Sonne

La géologie, une science plus que passionnante … et diverse