by P. Homewood, Aug 25, 2024 in NotaLotofPeopleKnowThat
For over a year, surface temperatures in the Atlantic Ocean hit new highs, but that trend has reversed at record speed over the past few months, and nobody knows why.
In June, temperatures in the Atlantic were 2 to 5 degrees Fahrenheit (1 to 3 degrees Celsius) hotter than normal in much of the ocean, with some areas getting as much as 9 degrees F (5 degrees C) warmer than average. Those temperatures weren’t a one-off, as the Atlantic had regularly seen record-breaking levels since March 2023. That year marked the fourth in a row that the world’s oceans set new heat records.
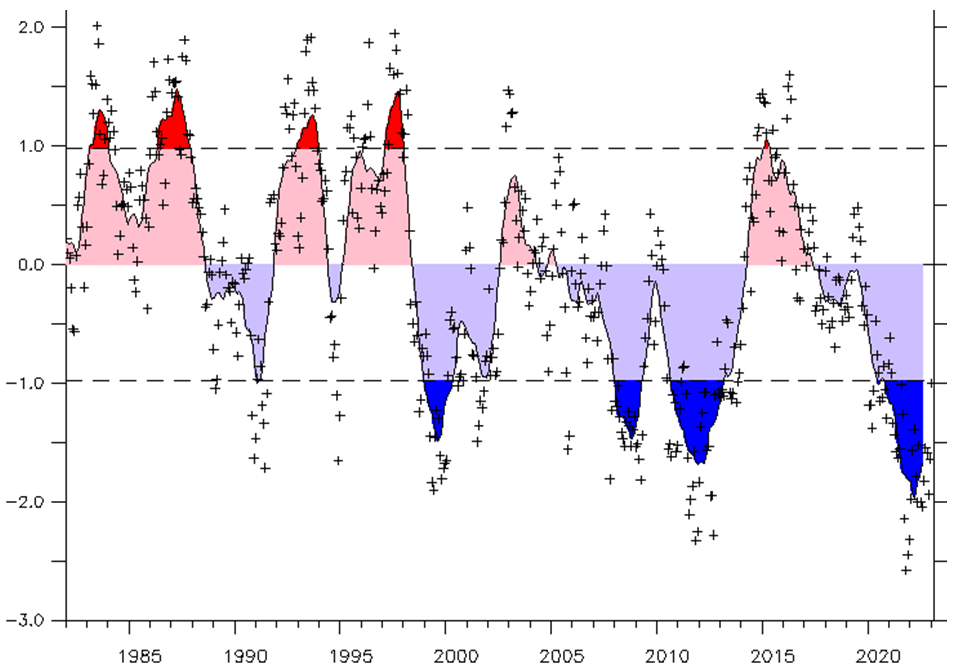
The hot water was partially a result of human-caused climate change, but it was also due to a particularly strong El Niño in 2023 and 2024. But that system appears to have passed, according to the National Oceanic and Atmospheric Administration.
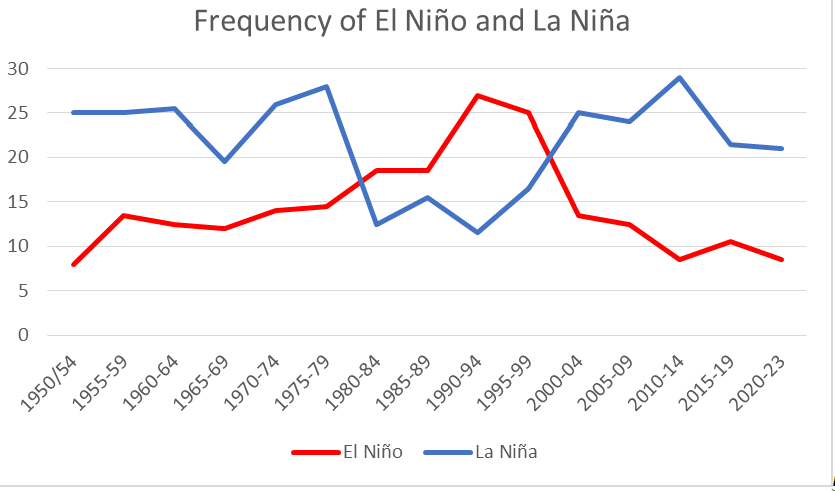
NOAA data shows Atlantic sea surface temperatures have cooled at a surprising rate since May. Since June began, temperatures have been a degree or two Fahrenheit colder than normal for this time of year. That means El Niño will likely be replaced by its counterpart, La Niña, a weather system that allows cold water to rise to the surface of the Atlantic, some time between September and November. Both El Niño and La Niña are complex systems driven by trade winds, solar heating, and rainfall in the tropic regions, and can be difficult to predict. Still, the sudden shift in Atlantic temperatures has been puzzling, and nobody seems to know why it’s happened so quickly.
“We’ve gone through the list of possible mechanisms, and nothing checks the box so far,” Frans Philip Tuchen, a postdoctoral student at the University of Miami, told New Scientist.
https://gizmodo.com/the-atlantic-is-cooling-at-a-mysteriously-fast-rate-after-record-warmth-2000488967
.So they do not have a clue why the Atlantic has suddenly got colder, but they think they know that global warming made it hotter in the first place, even though there is no physical for the claim that a slightly warmer atmosphere can make any measurable difference to ocean temperatures!
They also get their knickers in a complete twist stating that El Ninos in the Pacific raise SSTs in the Atlantic!
…