by Prof. F. Vahrenholt, May 13, 2025 in NoTricksZone
If you look at the climate website of the Helmholtz Association with the ambitious name “Climate Facts” under Antarctica, you will read the following: “The important mainland ice of Antarctica is disappearing, and at an increasing rate”. According to the Helmholtz Association, this is of great significance for rising sea levels. And indeed, the rising sea level caused by the melting Antarctic ice is one of the central arguments of climate policy that has worried people.
This makes the result of a recently published study, according to which the picture has changed since 2021, all the more surprising: Antarctica’s continental ice is increasing again.
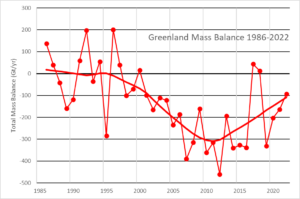
Chinese researchers from Tongji University led by Prof. Shen and Dr. Wang found that Antarctic ice masses have increased significantly since 2021. The data evaluated by NASA’s GRACE satellite showed an annual loss of 74 billion tons per year from 2002 to 2010. From 2011 to 2020, the amount even doubled. Now the ice has increased by around 108 billion tons year on year.

Source: Science China Press)
As the melting of the Antarctic glaciers contributed around 20% to sea level rise, a slowdown in the rise has been observed since 2021. Wouldn’t this good news be worth reporting on the news? Not so far.
…