
by K. Richard, Aug 30, 2024 in WUWT
“Clearly, the atmospheric CO2 observation data are not consistent with the climate narrative. Rather, they contradict it.” – Koutsoyiannis, 2024
Per a new study, the Intergovernmental Panel on Climate Change (IPCC) utilizes “inappropriate assumption and speculation,” as well as non-real-world models of “imaginary data,” to claim CO2 emissions derived from fossil fuel burning function “weirdly,” far differently in the atmosphere than CO2 molecules derived from natural emissions (e.g., plant respiration, ocean outgassing) do.
“The ambiguity is accompanied by inappropriate assumptions and speculations, the weirdest of which is that the behavior of the CO2 in the atmosphere depends on its origin and that CO2 emitted by anthropogenic fossil fuel combustion has higher residence time than when naturally emitted.”
While the IPCC acknowledges emissions from natural sources have an atmospheric residence time of only 4 years, they have simultaneously constructed model outputs that assert CO2 molecules derived from fossil fuel emissions remain in the atmosphere for hundreds, thousands, tens of thousands, even several one hundred thousands of years.
Per the IPCC:
“15 to 40% of an emitted CO2 pulse [from anthropogenic emissions] will remain in the atmosphere longer than 1000 years, 10 to 25% will remain about ten thousand years, and the rest will be removed over several hundred thousand years.”
“Carbon dioxide (CO2) is an extreme example, its turnover time is only about 4 years because of the rapid exchange between the atmosphere and the ocean.”
Again, a four-year residence time for natural CO2, but hundreds of thousands of years residence time for CO2 molecules elicited from fossil fuel burning. It would seem just about any result can be derived from imaginary data.
…
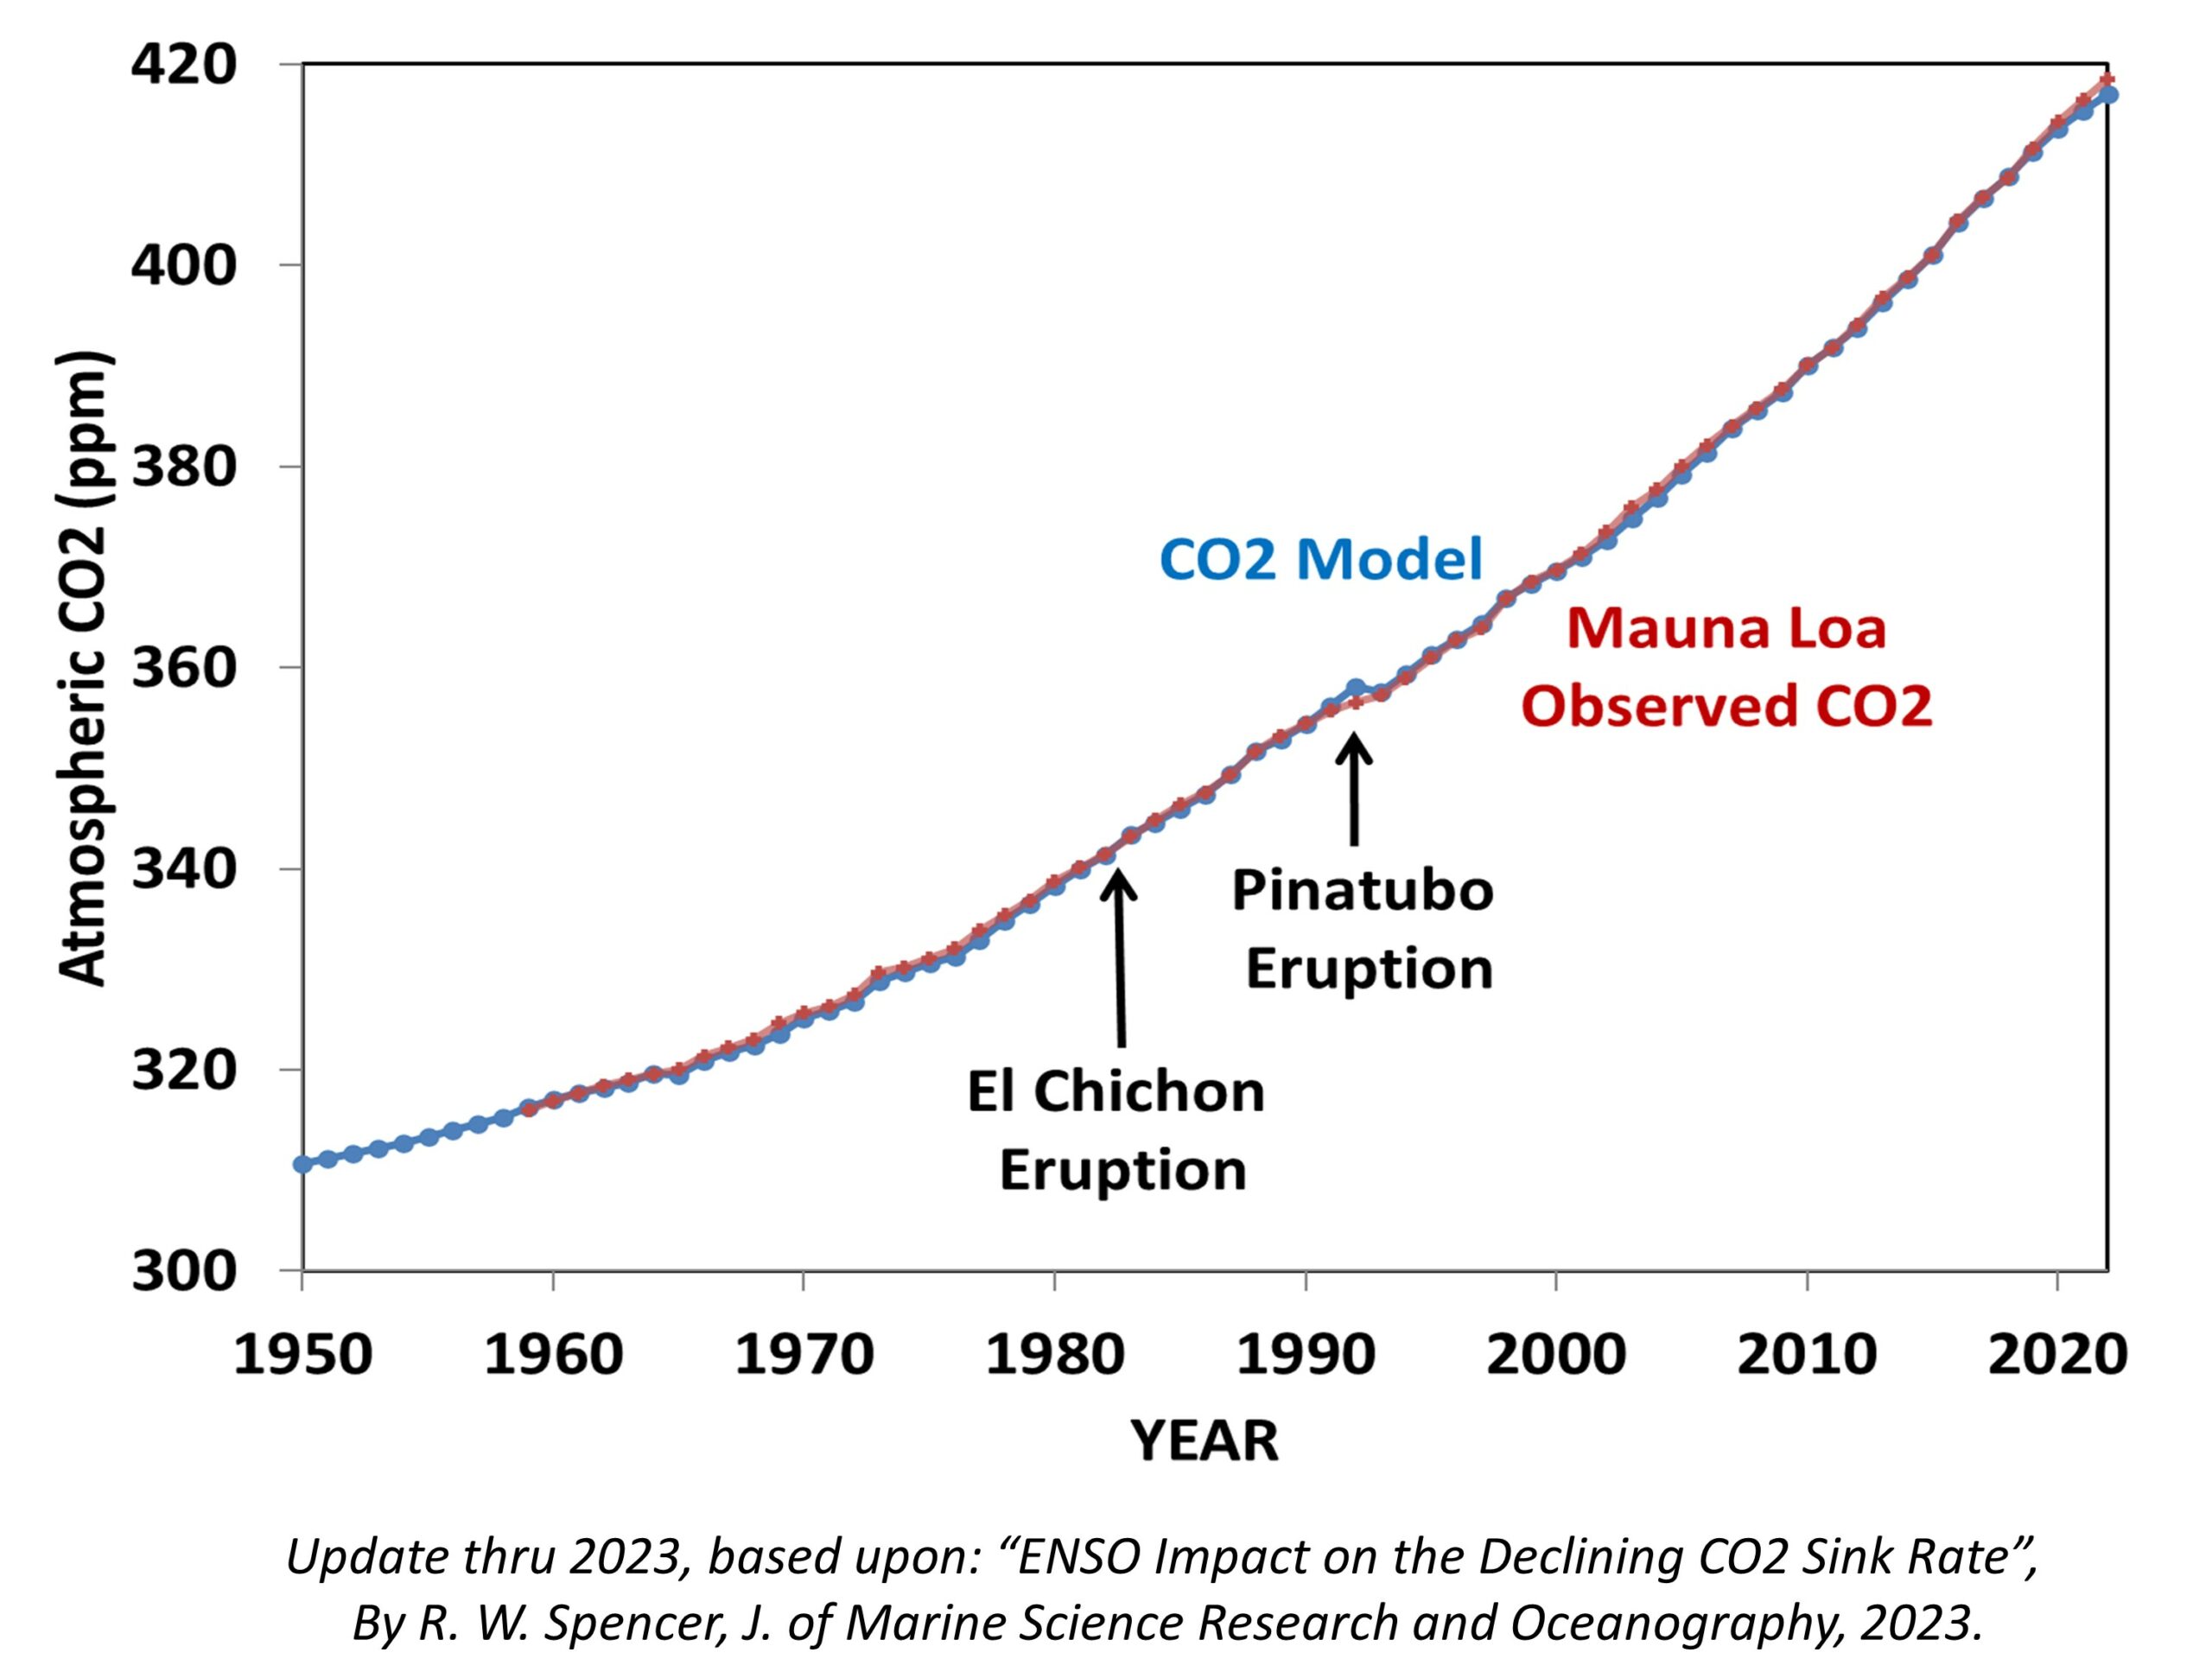
Instead of relying on models built on assumption and speculation, Dr. Koutsoyiannis utilizes a well-established, hydrology-based theoretical framework (refined reservoir routing, or RRR) combined with real-world CO2 observations to robustly conclude the residence time for all CO2 molecules, regardless of origin, is between 3.5 and 4 years.
The applied theoretical results match the empirical results so closely (e.g., an empirical mean of 3.91 years vs. a theoretical mean of 3.94 years at Barrow, and an identical 3.68 years for both empirical and theoretical means at Mauna Loa from 1958-2023) that the theoretical framework can be said to be “close to perfect.” In other words, the consistency of the applied calculation with real-world observations provides robust evidence that CO2 residence time is likely close to this range.
In contrast, the calculated probability for the modeled, imaginary-data-based claim that the residence time for a CO2 molecule persists for over 1000 years is 10⁻⁶⁸, which means the probability value is “no different from an impossibility.”
…

