by W. Eschenbach, Apr 20, 2024 in WUWT
I got to thinking about sea ice and the climate models. Here’s what we know about polar sea ice extent, showing data that starts with the satellite era when we began to have accurate observations of the poles.

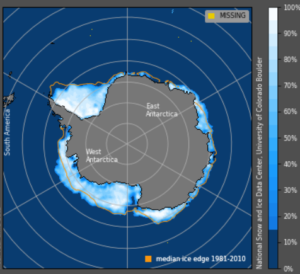
Figure 1. Arctic, Antarctic, and global sea ice extent. Colored lines are CEEMD smooths of the underlying datasets.
Now, there are some rather large curiosities regarding the sea ice extent records.
- The North Pole is a liquid ocean covered with sea ice, with most of the ice polewards of 70°N. The South Pole is a giant chunk of frozen rock surrounded by sea ice, with almost no ice polewards of 70°S. So why do both poles have about the same extent of sea ice?
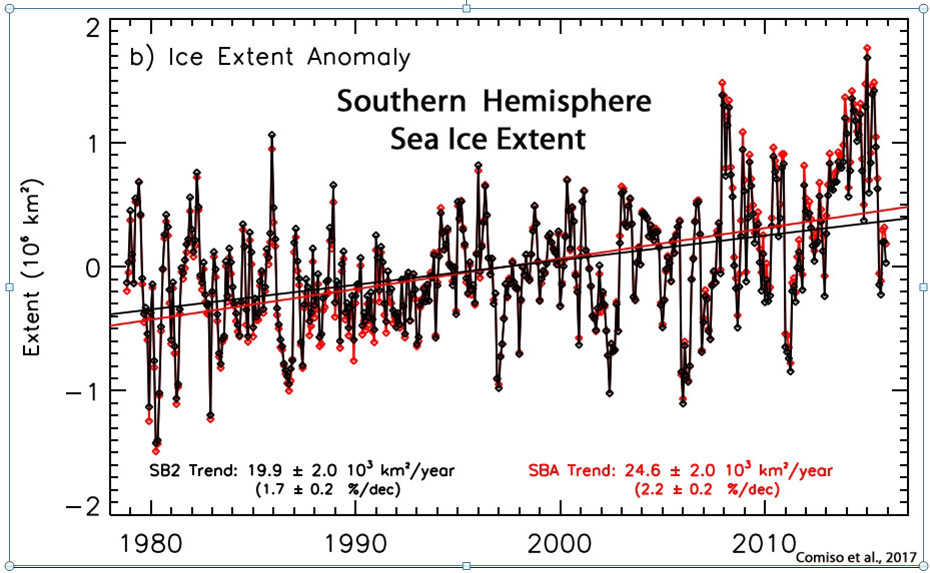
- From the start of the satellite era up until ~2015, Arctic sea ice extent was decreasing and Antarctic sea ice extent was increasing … and as a result, total global sea ice extent was relatively constant, with 2014 having about the same global sea ice extent as 1978. Why?
- Around 2015, Antarctic sea ice extent started dropping rapidly … but Arctic sea ice stopped dropping and leveled off up to the present. Why?
- After dropping precipitously for a couple of years, Antarctic sea ice extent leveled off again … and as a result, global ice extent also leveled off. Why?
Here’s the interesting part. Nobody knows the answers to any of those questions. And I suppose predictably, since they’re based on our (mis)understandings of the climate, none of the climate models either forecasts or hindcasts sea ice extent doing anything even remotely similar to the actual observations.
So I’ll leave this here as a testament to just how little we understand the magnificent global heat engine that we call the climate …