Archives par mot-clé : Global Temperature

Hottest January? Latest BBC Lies!

by P. Homewood, Feb 6, 2025 in NotaLotofPeopleKnowThat


Last month was the world’s warmest January on record raising further questions about the pace of climate change, scientists say.

January 2025 had been expected to be slightly cooler than January 2024 because of a shift away from a natural weather pattern in the Pacific known as El Niño.

But instead, last month broke the January 2024 record by nearly 0.1C, according to the European Copernicus climate service.

https://www.bbc.co.uk/news/articles/cwyjk92w9k1o

The reality is somewhat different, as satellites show that global temperatures have been in freefall in recent months. Since September 2024, they have fallen by a full half a degree celsius.

Last month was not even the hottest January, as January 2024 was 0.4C hotter


https://www.drroyspencer.com/latest-global-temperatures/

Scientists have now said that much of the recent spike in temperatures has been caused by reduced sulfate emissions from shipping, thanks to new clean air regulations.

Wildfires

The BBC lead their article with a photo of the LA wildfires. The impression, which they clearly want to create, is that these fires are connected to global temperatures.

It proves that their whole article cannot be taken seriously.

Scientists don’t know why 2024 was so hot

by D. Whitehouse, Jan 29, 2025 in NetZeroWatch


2024 broke many records.

There’s no doubt that 2024 was the hottest year of the instrumental period. But why it was so warm is not exactly clear, even with the backdrop of increasing global temperatures.

Over the years we have heard a lot about consensus when it comes to climate science. Sometimes it has been manufactured, for example the suggestion that 97% of all scientists believe global warming is real, but in many cases it does represent what is at least a snapshot of what scientists think is happening.

So it was on December 10th at the American Geophysical Union meeting in Washington. A show of hands was requested in answer to the question as to whether we understand why 2023 and 2024 was so hot. Very few hands were raised. Asked a slightly different question, the majority of the audience raised their hands to the proposition that we can’t explain it.

The spike in, already elevated, global temperatures of 2023 and 2024 is beyond what can be explained by more CO2 in the atmosphere. It can’t be explained with El Niño, volcanic emissions or the decline in ship fuel pollution letting more sunlight reach the ocean. Something else is going on.

One team of researchers have suggested it’s due to a decrease in low cloud, which tends to cool our planet. If this is so, then it is important to see if it is a blip or a trend.

Reporting certainty

Such scientific niceties haven’t bothered most reporters dealing with the record-breaking warmth of 2024, which broke the 1.5°C Paris Agreement boundary.

Given that the increase is unexplained, is it wise to present it as evidence of a dangerous new phase in our broken clime, as New Scientist did? Despite the uncertainties, they say that Earth’s climate systems are no longer behaving as they should. It points to the wavering Jet Stream and the recent Californian wildfires as proof, even though it’s technically possible to explain these effects without climate change, catastrophic or not.

New Scientist says the one thing we can now expect ‘with certainty’ is that we ‘should’ expect extreme weather events to become more frequent. What is it? Is it certain, or just something that should happen?

The uncertainty extends into 2025. It was expected that El Niño, which boosted 2023 and 2024 temperatures, would have declined by mid-year, but it didn’t. It has hung on and is expected to linger for most of this year, to be followed by a weak and brief cooling La Niña.

I wonder if there will be another show of hands by puzzled scientists at the end of 2025.

UAH v6.1 Global Temperature Update for December, 2024: +0.62 deg. C

by R. Spencer, Jan 3, 2025 in WUWT


2024 Sets New Record for Warmest Year In Satellite Era (Since 1979)

The Version 6.1 global average lower tropospheric temperature (LT) anomaly for December, 2024 was +0.62 deg. C departure from the 1991-2020 mean, down slightly from the November, 2024 anomaly of +0.64 deg.

The Version 6.1 global area-averaged temperature trend (January 1979 through December 2024) remains at +0.15 deg/ C/decade (+0.22 C/decade over land, +0.13 C/decade over oceans).

As seen in the following ranking of the years from warmest to coolest, 2024 was by far the warmest in the 46-year satellite record averaging 0.77 deg. C above the 30-year mean, while the 2nd warmest year (2023) was +0.43 deg. C above the 30-year mean. [Note: These yearly average anomalies weight the individual monthly anomalies by the number of days in each month.]

Recent Temperature Falls Likely to Put a Dampener on ‘Hottest Year Evah’ Stories

by C. Morrison, Dec 28, 2024 in TheDailySceptic


Stand by for another bout of ‘Hottest Year Evah’ stories as the mainstream media pursues its campaign to induce mass climate psychosis and prepare the ground for the oncoming Net Zero catastrophe. Alas, enjoy it only a little while longer since this story may have to be retired after putting in such a sterling propaganda shift. Global temperatures are falling like a stone, while the oceans are cooling at a remarkably rapid rate. In the U.K., the year is likely to show a second annual temperature fall since the alleged ‘record’ year in 2022.

Only last May, Matt McGrath and Justin Rowlatt at the BBC were claiming that “fuelled by climate change” the world’s oceans had broken temperature records every single day over the past year. Planet-warming gases were said to be “mostly to blame”. Three days were singled out when the previous highs were beaten by 0.34°C. Inexplicably, the story, a matter it might be thought of some ongoing concern, was not followed up. The graph below, compiled from data supplied by the U.S. weather service NOAA, might help explain why.

Climate Change over the past 4000 Years

by A. May, Dec4, 2024 in WUWT


I last wrote about Climate Change and Civilization for the past 4,000 Years in 2016. Since then, a lot has changed, and I’ve learned a lot more about the subject. First, we learned that various air and sea temperature proxies, such as ice core δ18O or tree rings, are all different. For a discussion of some temperature proxies used and the problems with them, see here. Proxies have different accuracies, they are often sensitive to the temperature of different seasons, and they have different temporal resolutions. Thus, as pointed out by Soon and Baliunas in 2003, they are all local and “cannot be combined into a hemispheric or global quantitative composite.”

The global average surface temperature (GAST) reconstruction relied upon in the IPCC AR6 report was by Kaufman, et al. The authors admit that the average spacing of each temperature (the temporal resolution) is 164 years. Thus, to compare the entire global instrumental temperature record to the proxies in a valid way, one must average all the daily readings since 1860 into one point. That is, the rate of warming since 1860 is irrelevant, the proxy record cannot see a 164-year increase. The problem of comparing daily modern instrumental temperature records to proxies is discussed by Renee Hannon here.

Media Hypes Report That 2024 Will Break 1.5°C Limit, But Data Doesn’t Back It Up

by L. Lueken, Nov 11, 2024 in ClimateChangeDispatch


valencia flood aftermath

Multiple outlets have posted articles covering a report from the European Copernicus Climate Change Service (“Copernicus”) which says that 2024 will be the first to surpass 1.5°C warming since preindustrial times, which the media claims will cause untold weather disasters. [emphasis, links added]

This is mostly false.

Although 2024 will likely have higher average temperatures than in recent decades, it is not the end of the year yet, and there is limited evidence to support the claim that it will represent the highest temperatures humans have ever experienced and no evidence whatsoever that weather disasters have gotten or will get worse.

The BBC and CNN are among the numerous mainstream media outlets reporting on Copernicus’ report.

CNN describes the report as “devastating news for the planet that comes as America chooses a president that has promised to undo its climate progress both at home and abroad.”

The Copernicus group estimates that 2024 will end up 1.55°C hotter than the 1850-1900 average, which is 0.05°C above the warming limit set by the Paris Agreement. This may be true, but there is no evidence that the 1.5℃ threshold is some kind of deadly tipping point for weather disasters.

The same organization sounded the alarm last year that the “limit” was breached for several months in a row while ignoring natural factors like an underwater volcano eruption.

As for the 1.5-degree limit itself, it was not established by professional climate scientists. Only one of the people who were on the panel who came up with the value was even a meteorologist.

Two other points worth noting. The claim is a bit of sleight of hand, cherry-picking the data for comparison. Earth was only just coming out of the Little Ice Age at the onset of the 1850 period, one of the coldest periods during the past millennia.

When you pick an unusually cold period for comparison, modest warming seems more dramatic than it is.

Second, the 1.5℃ is an arbitrary temperature choice. As Climate Realism has discussed repeatedly here, here, and here, it was chosen by politicians for political reasons.

There is no scientific evidence it represents some tipping point for catastrophic climate change. The world has likely warmed more than 2°C since the 1700s, with no apocalypse.

One would think that if warming causes more extreme weather there would be solid data and identifiable consistent trends showing an increase in extreme weather, but there is none.

Three of the weather events CNN cites at the end of their article as proof of a supposed climate emergency, Hurricane Milton, the flooding in Spain, and low snow amounts at Mt. Fuji are not proof of a climate emergency.

Despite Media Panic, There Is No Reason to Think 2024’s Warming Is Disastrous

by L. Lueken, Nov 10, 2024 in WUWT


Multiple outlets have posted articles covering a report from the European Copernicus Climate Change Service (“Copernicus”) which says that 2024 will be the first to surpass 1.5°C warming since pre-industrial times, which the media claims will cause untold weather disasters. This is mostly false. Although it is likely that 2024 will have higher average temperatures than in recent decades, it is not the end of the year yet, and there limited evidence to support the claim that it will represent the highest temperatures humans have ever experienced and no evidence whatsoever that weather disasters have gotten or will get worse.

The BBC and CNN are among the numerous mainstream media outlets reporting on Copernicus’ report.

CNN describes the report as “devastating news for the planet that comes as America chooses a president that has promised to undo its climate progress both at home and abroad.”

The Copernicus group estimates that 2024 will end up 1.55°C hotter than the 1850-1900 average, which is 0.05°C above the warming limit set by the Paris Agreement. This may be true, but there is no evidence that the 1.5℃ threshold is actually some kind of deadly tipping point for weather disasters. The same organization sounded the alarm last year that the “limit” was breached for several months in a row, while ignoring natural factors like an underwater volcano eruption. As for the 1.5 degree limit itself, it was not established by professional climate scientists. Only one of the people who were on the panel that came up with the value was even a meteorologist.

Two other points worth noting. The claim is bit of sleight of hand, cherry picking the data for comparison. Earth was only just coming out of a little ice age at the onset of the 1850 period, one of the coldest periods during the past millennia. When you pick an usually cold period for comparison, a modest warming seems more dramatic than it is.

Second, the 1.5℃ is an arbitrary temperature choice. As Climate Realism has discussed repeatedly, herehere, and here, for example, it was chosen by politicians for political reasons. There is no scientific evidence it represents some tipping point for catastrophic climate change. It is likely that the world has warmed more than 2°C since the 1700s, with no apocalypse.

The 2023 global warming spike was driven by the El Niño–Southern Oscillation

by S.P. Raghuraman et al., Oct 2024 in EGU-APCPapers


Abstract

Global-mean surface temperature rapidly increased 0.29 ± 0.04 K from 2022 to 2023. Such a large interannual global warming spike is not unprecedented in the observational record, with a previous instance occurring in 1976–1977. However, why such large global warming spikes occur is unknown, and the rapid global warming of 2023 has led to concerns that it could have been externally driven. Here we show that climate models that are subject only to internal variability can generate such spikes, but they are an uncommon occurrence (p= 1.6 % ± 0.1 %). However, when a prolonged La Niña immediately precedes an El Niño in the simulations, as occurred in nature in 1976–1977 and 2022–2023, such spikes become much more common (p= 10.3 % ± 0.4 %). Furthermore, we find that nearly all simulated spikes (p= 88.5 % ± 0.3 %) are associated with El Niño occurring that year. Thus, our results underscore the importance of the El Niño–Southern Oscillation in driving the occurrence of global warming spikes such as the one in 2023, without needing to invoke anthropogenic forcing, such as changes in atmospheric concentrations of greenhouse gases or aerosols, as an explanation.

El Niño fingered as likely culprit in record 2023 temperatures

by P. Voosen, Oct 10, 2024 in Science


For the past year, alarm bells have been going off in climate science: Last year’s average global temperature was so high, shooting up nearly 0.3°C above the previous year to set a new record, that human-driven global warming and natural short-term climate swings seemingly couldn’t explain it. Some, like famed climate scientist James Hansen, suggestedEarth is entering an ominous new phase of accelerated warming, driven by a rapid decline in sunlight-dimming air pollution. Others, like Gavin Schmidt, director of NASA’s Goddard Institute for Space Studies, said the rise might represent a “knowledge gap,” some new climate feedback that might tip the planet toward a future even warmer than models predict.

Now, a new series of studies suggests most of the 2023 jump can be explained instead by a familiar climate driver: the shifting waters of the tropical Pacific Ocean. The combination of a 3-year-long La Niña, which suppressed global temperatures from 2020 to 2022, followed by a strong El Niño could account for the unexpected temperature jump, the work suggests. “Earth can do this,” says Shiv Priyam Raghuraman, a climate scientist at the University of Illinois Urbana-Champaign, who led one study.

During La Niña, strong trade winds push warm surface water west along the equator toward Indonesia and pull up a fountain of deep, cold water in the eastern Pacific that helps cool the planet. During El Niño, the winds collapse, allowing warm water to slosh east and shut off the ocean air conditioner. Continuer la lecture de El Niño fingered as likely culprit in record 2023 temperatures

NOAA’s Data Shows Rising Average Temps Driven By Growth And Measurement Flaws—Not Climate Change

by L. Hamlin, Oct 7, 2024 in ClimateChangeDispatch


NOAA’s U.S. contiguous U.S. summer measured minimum and maximum temperature trends (June through August) over the period 1895 through 2024 (shown below from NOAA’s Climate at a Glance Times series data website) show clear and distinct differing temperature trend increasing growth compared to the calculated average temperature trend outcome. [emphasis, links added]

The minimum temperature trend outcomes after 1985 climb significantly faster than the maximum measured temperature trend outcomes. U.S. population data shows an increase of about 100 million during the 1980 to 2023 period.

Since the average temperature is not a measured value but instead the calculated mathematical average of the minimum and maximum measured temperatures {(Tmax + Tmin)/2}, the average temperature-calculated trend outcome is controlled and dominated by the much larger increase occurring in the minimum-measured temperature trend versus the maximum measured temperature trend.

UAH Global Temperature Update for August, 2024: +0.88 deg. C

by P. Homewood,  Sep 2, 2024 in NotaLotofPeople KnowThat


From Dr. Roy Spencer’s Global Warming Blog.

The Version 6 global average lower tropospheric temperature (LT) anomaly for August, 2024 was +0.88 deg. C departure from the 1991-2020 mean, up slightly from the July, 2024 anomaly of +0.85 deg. C.

Persistent global-averaged warmth was (unusually) contributed to this month by the Southern Hemisphere. Of the 27 regions we routinely monitor, 5 of them set record-warm (or near-record) high monthly temperature anomalies in August, all due to contributions from the Southern Hemisphere:

Global land: +1.35 deg. C

Southern Hemisphere land: +1.87 deg. C

Southern Hemisphere extratropical land: +2.23 deg. C

Antarctica: +3.31 deg. C (2nd place, previous record was +3.37 deg. C, Aug. 1996)

Australia: +1.80 deg. C.

The linear warming trend since January, 1979 now stands at +0.16 C/decade (+0.14 C/decade over the global-averaged oceans, and +0.21 C/decade over global-averaged land).

The following table lists various regional LT departures from the 30-year (1991-2020) average for the last 20 months (record highs are in red):

Global Temperature updated for August 2024

by C. Best, Aug 27, 2024 in SciTravelOpinion


The global temperature anomaly for August was 1.27 deg.C relative to a 1961-1990 baseline. These results use GCHN monthly land temperatures combined with HadSST4 ocean temperatures. I use a novel method to calculate this using a 3D spherical triangulation of the earth’s surface. This is shown below.

The monthly trends relative to the 1961-1990 baseline are shown below.

Temperature trends

One of the problems with Global Warming is that the underlying temperature trends are superimposed on far larger but shorter natural variability cycles (El Nino). Therefore it makes little sense to push for action based on just one month’s temperature. It may even take another decade to be certain that average temperatures really have exceeded  1.5 C.

A far better method to determine when this will happen is based on using Icosahedral grids with decadal averaging 

The observed stable decadal trend shows that the Paris Agreement to limit warming to 1.5C since the preindustrial level will very likely be exceeded in 2032

New Study: Central Europe Was ‘2-5°C Warmer Than Present’ Throughout Most Of The Holocene

by K. Richard, July 22, 2024 in NoTricksZone


There were millennia during the past glacial (when CO2 levels were under 200 ppm) that were as warm or warmer than today.

Four central Europe reconstructions, using collected evidence from disparate biomarkers, indicate there were periods (for example, 54,000 to 51,000 years ago, the Bølling–Allerød interstadial, 14,700 years ago) during the last glacial when temperatures were as warmer than (or similar to) today (Zander et al., 2024).

Temperatures throughout the Holocene (8,000 to 4,000 years ago), when CO2 hovered around 265 ppm, were 3.5°C (and up to 5°C) warmer than today. Modern temperatures are among the coldest of the last 10,000 years.

Causality Analysis Finds Temperature Changes Have Determined CO2 Changes Since The Phanerozoic

by K. Richard, July 15, 2024 in NoTricksZone


Popular claims that CO2 changes drive temperature changes currently or throughout the distant past “are based on imagination and climate models full of assumptions.”

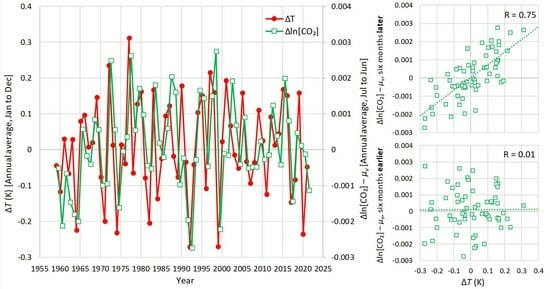
A comprehensive new study details a stochastic assessment determination of the sequencing of CO2 variations versus temperature variations since the 1950s, over the last 2,000 years (the Common Era), and throughout the last 541 million years.

The robust conclusion is that the causality direction – with the understanding that causes lead and effects lag – clearly shows the temperature changes lead and CO2 changes lag on yearly, decadal, and centennial/millennial scales. In other words, “the reverse causality direction [CO2]→T should be excluded.”

The claim that CO2 increases drive temperature changes is thus a “narrative” only, as the claim that “humans, through their emissions by fossil fuel burning, are responsible for the changes we see in climate” can be regarded as a “non-scientific issue.”


The author has had a series of peer-reviewed scientific papers published supporting this same T→CO2 conclusion (Koutsoyiannis et al., 2022, Koutsoyiannis et al., 2020, Koutsoyiannis et al., 2023, Koutsoyiannis, 2024, Koutsoyiannis, 2024) in just the last few years.

Since these papers challenge the prevailing anthropogenic global warming (AGW) narrative so acutely, Dr. Koutsoyiannis has understandably been the recipient of antagonism bordering on vitriol from AGW proponents. This includes comments from peer-reviewers. So, in an apparent effort to foster transparency, he has made the peer reviewers’ comments on this latest paper public. Here is the link to these commentaries:

Peer reviewers’ exchanges with Koutsoyiannis in “Stochastic assessment of temperature–CO2 causal relationship in climate from the Phanerozoic through modern times.”


Media Reports Earth’s ‘1.5C Temperature limit’ was ‘breached for 12 months in a row’ – Nothing Bad Happened

by A. Watts, July 10, 2024 in WUWT


Originally posted at ClimateREALISM

Recently, several media outlets claimed that June 2024 was the hottest June on record globally and that it topped off a string of 12 or 13 warmer than normal months, which they blamed on human-induced climate change. Each of the news stories made false claims of reaching climate tipping pointsextreme weather events, and that the extended streak of hot temperatures proved a “climate crisis” was at hand.

Here are some of the headlines: Temperatures 1.5C above pre-industrial era average for 12 months, data shows (The Guardian,June sizzled to a 13th straight monthly heat record, but July might break string (National Public Radio,) and World in line for hottest year as 1.5C limit breached for 12 months in a row (Financial Times.)

That ongoing 1.5C temperature limit scare-story has people around the world rattled. For example, this infographic from The Asia-Pacific branch of the International Union of Food workers (IUF) says (bold author’s):

Global warming caused by human activities reached approximately 1°C over the past 170 years, increasing at 0.2°C per decade. Scientists warn that an average rise of more than 1.5°C in the surface temperature of the earth compared to pre-industrial levels will be catastrophic for the environment and human health.

But despite 12 months of the globe being above the so-called temperature limit, nothing bad happened on a global scale. Claims of climate catastrophe once we passed the so-called 1.5C temperature limit, never happened. The limit was nothing more than a political talking point from the 2015 Paris Climate Conference, as described in this Associated Press article: The magic 1.5: What’s behind climate talks’ key elusive goal. The AP wrote, “in a way both the ‘1.5 and 2 degree C thresholds are somewhat arbitrary,’ Stanford University climate scientist Rob Jackson said in an email. ‘Every tenth of a degree matters!’”

Now, despite surpassing that arbitrary limit, the “crisis” progressive politicians and alarmists in the mainstream media have been warning about failed to materialize.

First let’s check the global temperature. The source of all these news stories comes from a recent press release by Copernicus, part of the European Commission. A graph by Copernicus, seen in Figure 1 below, illustrates the “limit” and the 12-month temperature peak:

Official Temperature Data Isn’t ‘Data’ At All

by H.S. Burnett, Apr 21, 2024 in WUWT


IN THIS ISSUE:

  • Official Temperature Data Isn’t ‘Data’ At All
  • Video of the Week: This is hilarious! Is there nothing that climate change can’t do?
  • Human Impact on the Carbon Cycle Is Minimal
  • Islands Still Growing in the Midst of Climate Change
  • Podcast of the Week: Save the Whales, Kill the Turbines – The Climate Realism Show #104
  • Climate Comedy
  • Recommended Sites

L A Times Cherry Picks & Misrepresents NOAA Climate Data to Exaggerate March 2024 U.S. and Global Temperature Outcomes

by L. Hamlin, Apr 19, 2024 in WUWT


The L A Times article and headline shown below exaggerate the March 2024 U.S. and global temperature outcomes by cherry picking and misrepresenting data that mischaracterizes what the data actually shows.


The Times article makes the following claims regarding the U.S. for the period January through March 2024:

“In the United States, March was the 17th warmest in the 130-year data record, according to the National Oceanic and Atmospheric Administration. The average temperature in the contiguous U.S. was 45.1 degrees — 3.6 degrees above average.”

The Times article does not present readily available NOAA measured  Maximum Contiguous U.S Temperature for the month of March from 1895 through 2024 as shown below.

UAH Global Temperature Update for March, 2024: +0.95 deg. C

by R. Spencer, Apr 2, 2024 in WUWT


The Version 6 global average lower tropospheric temperature (LT) anomaly for March, 2024 was +0.95 deg. C departure from the 1991-2020 mean, up slightly from the February, 2024 anomaly of +0.93 deg. C, and setting a new high monthly anomaly record for the 1979-2024 satellite period.

New high temperature records were also set for the Southern Hemisphere (+0.88 deg. C, exceeding +0.86 deg. C in September, 2023) and the tropics (+1.34 deg. C, exceeding +1.27 deg. C in January, 2024). We are likely seeing the last of the El Nino excess warmth of the upper tropical ocean being transferred to the troposphere.


MWP 1.5C Warmer Than 1900–Says HH Lamb

by P. Homewood, Apr 1, 2024 in NotaLotofPeopleKnowThat


The Central England Temperature series is the longest running in existence, but still only goes back to 1659, pretty much the depth of the Little Ice Age, so it tells us little of real meaning.

However there exist many very real measures of temperatures going back much further – and I am not referring to the fraudulently used tree rings and the like.

HH Lamb published this chart in his book “Climate: Past, Present and Future” in 1977:

EXCLUSIVE: A Third of U.K. Met Office Temperature Stations May Be Wrong by Up to 5°C, FOI Reveals

by C. Morrison, March 1, 2024 in TheDailySceptic


Nearly one in three (29.2%) U.K. Met Office temperature measuring stations have an internationally-defined margin of error of up to 5°C. Another 48.7% of the total 380 stations could produce errors up to 2°C, meaning nearly eight out of ten stations (77.9%) are producing ‘junk’ or ‘near junk’ readings of surface air temperatures. Arguably, on no scientific basis should these figures be used for the Met Office’s constant promotion of the collectivist Net Zero project. Nevertheless, the state-funded operation frequently uses them to report and often catastrophic rises in temperature of as little as 0.01°C.

Under a freedom of information request, the Daily Sceptic has obtained a full list of the Met Office’s U.K. weather stations, along with an individual class rating defined by the World Meteorological Office. These CIMO ratings range from pristine class 1 and near pristine class 2, to an ‘anything goes’ or ‘junk’ class 5. The CIMO ratings penalise sites that are near any artificial heat sources such as buildings and concrete surfaces. According to the WMO, a class 5 site is one where nearby obstacles “create an inappropriate environment  for a meteorological measurement that is intended to be representative of a wide area”. Even the Met Office refers to sites next to buildings and vegetation as “undesirable”. It seems class 5 sites can be placed anywhere, and they come with a WMO warning of “additional estimated uncertainties added by siting up to 5°C”; class 4 notes “uncertainties” up to 2°C, while class 3 states 1°C. Only 13.7%, or 52 of the Met Office’s temperature and humidity stations come with no such ‘uncertainty’ warnings attached.

The above graph shows the percentage totals of each class. Class 1 and 2, identified in green, account for just 6.3% and 7.4% of the total respectively. Class 3 identified as orange comes in at 8.4%. The graph shows the huge majorities enjoyed by the darkening shades of red showing classes 4 and 5. It is possible that the margins of error identified for classes 3, 4 and 5 could be a minus amount – if for instance the measuring device was sited in a frost hollow – but the vast majority are certain to be pushed upwards by heat corruptions.


Meteorologist Debunks TIME Mag’s Claim That Jan 2024 Was Hottest On Record

by A. Watts, Feb 19, 2024 in ClimateChangeDispatch


An article in TIME Magazine (TIME) claims that January 2024 was the hottest ever on record for the planet. Titled, 2024 Had the Hottest January on Record Following 2023’s Hottest Year on Record the article is based on a single source of temperature data.

Data from multiple other sources of temperature measurements refute this claim. [emphasis, links added]

TIME refers to the Copernicus EU climate service as the source for its alarming claim. Copernicus EU issued a press release claiming:

January 2024 was the warmest January on record globally, with an average ERA5 surface air temperature of 13.14°C, 0.70°C above the 1991-2020 average for January and 0.12°C above the temperature of the previous warmest January, in 2020.

The month was 1.66°C warmer than an estimate of the January average for 1850-1900, the designated pre-industrial reference period.

The problem with that is that they are using a reference period of 1850 to 1900 that no other climate data source uses; a period, not coincidentally, more than 100 years of global warming ago when the Earth was cooler than today.

For example, NASA Goddard Institute for Space Studies (GISS) produced a map of the globe that shows a significantly lower global temperature for January 2024.

The GISS global value was just 1.20°C compared to the 1.66°C claimed by Copernicus is different because NASA GISS is using a base period of 1951 to 1980.

Copernicus seemingly cherry-picked the reference period to fit the climate crisis narrative, and TIME was too uninterested in seeking and presenting the truth to investigate the extraordinary claim, instead reporting it as an unchallenged fact.

Impacts and risks of “realistic” global warming projections for the 21st century

by N. Scafetta,  March 2024, in GeoscienceFrontier


Highlights

The IPCC AR6 assessment of likely impacts and risks by 21st-century climate changes is highly uncertain.

  • Most climate models, however, run too hot, and the SSP3-7.0 and SSP5-8.5 scenarios are unlikely.

  • New climate change projections for the 21st century were generated using best-performing climate models,

  • Empirical climate modeling of natural cycles, and calibration on lower troposphere temperature data.

  • Net-zero emission policies are not necessary because SSP2-4.5 is sufficient to limit climate change hazards to manageable levels.

Strong El Nino Conditions Prevails at The End of January 2024

by A. Patel, Feb 12, 2024 in WUWT


However, This El Nino Not Expected to Be as Strong As 1982-83 Or 1997-98 Or 2015-16 El Nino

Enso Status on 10th February 2024

Ashok Patel’s Analysis & Commentary :

The classification of El Niño events, including the strength labels, is somewhat subjective and can vary among meteorological and climate agencies. There isn’t a strict rule defining the specific number of consecutive Oceanic Niño Index (ONI) values that must be 2.0°C or above to categorize an El Niño event as “Super Strong.”

In general, a strong El Niño event is often characterized by ONI values reaching or exceeding +2.0°C. A Super Strong El Niño would typically involve sustained ONI value of +2.0°C or more. Hence for ease of understanding and comparing the strength of various Strong El Nino events, I propose to define an El Nino as a Super Strong event if  three consecutive ONI index is +2.0°C or more.

A brief history of the past El Nino events with the number of consecutive ONI +2.0°C or above:

In the year 1965 the highest ONI index during that El Nino were SON +2.0°C, OND +2.0°C

In the year 1972-73 the highest ONI index during that El Nino were OND +2.1°C NDJ +2.1°C DJF

In the year 1982-83 the highest ONI index during that El Nino were SON +2.0°C, OND +2.2°C NDJ +2.2°C DJF +2.2°C

In the year 1997-98 the highest ONI index during that El Nino were ASO +2.1°C SON +2.3°C, OND +2.4°C NDJ +2.4°C DJF +2.2°C

In the year 2015-16 the highest ONI index during that El Nino were ASO +2.2°C SON +2.4°C, OND +2.6°C NDJ +2.6°C DJF +2.5°C JFM +2.1°C

ONI Data has been obtained from CPC – NWS – NOAA available here

There have been three Super Strong El Nino events from 1950 onwards till date. The first such event was 1982-83 Super Strong El Nino with 4 consecutive ONI +2.0°C or above with highest ONI of +2.2°C twice. The second Super Strong El Nino event was 1997-98 with five consecutive ONI +2.0°C or above with highest ONI of +2.4°C twice. The third Super Strong El Nino event was 2015-16 with six consecutive ONI +2.0°C or above with highest ONI of +2.6°C twice. The current forecast and analysis does not support the 2023-24 El Nino to become a Super Strong El Nino.

Hottest 12 Months for 125,000 Years Claim Lacks Any Scientific Evidence

by C. Morrison, Jan 7, 2023 in TheDailySceptic, 


Last year humanity lived through the hottest 12 months in at least 125,000 years, reported an hysterical CNN, a frame of mind replicated throughout much of the mainstream media. Scientists have compared 2023’s “climate change fallout” to a “disaster movie”, added the U.S. cable news channel. All poppycock, needless to say, with a political Net Zero motive, and little if any scientific evidence to back it up. Accurate temperature records barely started before the 20th century, and recent measurements by fixed thermometers have been heavily corrupted by growing urban heat. It is in fact possible using proxy measurements to get a good idea of general temperature movements over the last 125,000 years. All the evidence points to periods of much higher temperatures, notably between 10,000 to 5,000 years ago. The latest science paper examining this trend has just been published, and it points to summer temperatures at least 1.5°C higher around 5,000 years ago in the eastern Mediterranean, at a time when civilisation was developing rapidly.