by B. Van Vliet-Lanoë, Jan 1, 2021 in ScienceClimatEnergie
Un hiver froid s’annonce : le premier d’une série qui devrait durer au moins jusqu’en 2053 (Youssef et al., 2009 ; Zharkova et al. 2015 ; Van Vliet, 2019), période où les médias nous assènent une disparition de la banquise estivale, des ours polaires et des phoques ! Ceci est favorisé par l’activité solaire réduite depuis et le minimum solaire actuel (Fig.1). Le cycle solaire suivant (n°25) devrait aussi être faible. Nous y sommes entrés sans un Minimum d’activité aussi profond que celui Dalton (1790-1830) qui a présidé à la « Bérézina ».
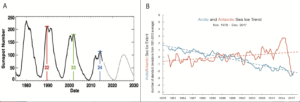
Fig. 1: Intensité des cycles solaires depuis 1975 et la prédiction du cycle 25 (calculés avec le nombre de taches solaires 2018 * ANRPFD ). B) évolution de l’extension en km2 des banquises arctique et antarctique depuis 1978 par rapport à la déviation standard 1981-2010 (NSDIC).
…
by C. Rotter, Jan 2, 2021 in WUWT
From Climate Resistance
Many climate alarmist’s failed predictions were centered around 2020. This video examines just ten, and argues that they were produced not by science, but by ideology. This is proved by the fact that rather than suffering any consequences to their careers or public standing, fearmongering individuals and institutions enjoy continued and undeserved success. The analysis of the ten predictions was produced by Steve Milloy and can be read at his website:
…
In his latest video the veteran geologist looks at wild fires worldwide and the CO2 they emit. He reports that both have been decreasing.
…
Citing the results of the European Copernicus satellite atmosphere monitoring service (CAMS), total wildfires globally have fallen steadily, along with their corresponding CO2 emissions:
…
by R. Spencer, Jan 2, 2020 in WUWT
The Version 6.0 global average lower tropospheric temperature (LT) anomaly for December, 2020 was +0.27 deg. C, down substantially from the November, 2020 value of +0.53 deg. C.For comparison, the CDAS global surface temperature anomaly for the last 30 days at Weatherbell.com was +0.31 deg. C.
2020 ended as the 2nd warmest year in the 42-year satellite tropospheric temperature record at +0.49 deg. C, behind the 2016 value of +0.53 deg. C.
Cooling in December was largest over land, with 1-month drop of 0.60 deg. C, which is the 6th largest drop out of 504 months. This is likely the result of the La Nina now in progress.
The linear warming trend since January, 1979 remains at +0.14 C/decade (+0.12 C/decade over the global-averaged oceans, and +0.18 C/decade over global-averaged land).
…
…
The full UAH Global Temperature Report, along with the LT global gridpoint anomaly image for December, 2020 should be available within the next few days here.
The global and regional monthly anomalies for the various atmospheric layers we monitor should be available in the next few days at the following locations:
Lower Troposphere: http://vortex.nsstc.uah.edu/data/msu/v6.0/tlt/uahncdc_lt_6.0.txt
Mid-Troposphere: http://vortex.nsstc.uah.edu/data/msu/v6.0/tmt/uahncdc_mt_6.0.txt
Tropopause: http://vortex.nsstc.uah.edu/data/msu/v6.0/ttp/uahncdc_tp_6.0.txt
Lower Stratosphere: http://vortex.nsstc.uah.edu/data/msu/v6.0/tls/uahncdc_ls_6.0.txt
La géologie, une science plus que passionnante … et diverse
