Failing Computer Models

by P. Homewood ,Jan 21, 2021 in NotaLotofPeopleKnowThat


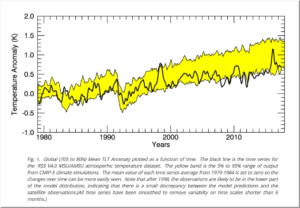
If anybody tries to tell you that the computer models are accurately predicting global warming, show them this:

http://www.remss.com/research/climate/#:~:text=The%20RSS%20merged%20lower%20stratospheric%20temperature%20data%20product,in%20well-mixed%20greenhouse%20gases%20causes%20by%20human%20activity.

It comes from RSS, who monitor atmospheric temperatures via satellite observation. They are ardent warmists, and here us what they have to say:

….

ANTARCTICA SUFFERING COLDEST JANUARY SINCE 1978 + GLOBAL SEA ICE GROWING EXPONENTIALLY

by Cap Allon, Jan 20, 2021 in Electroverse


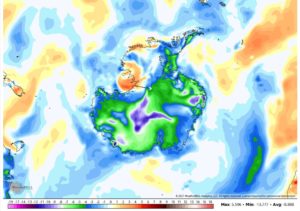
The start of 2021 in Antarctica has been an unusually chilly one. In fact, the first half of January has been the coldest since 1978, according to data compiled by @LpdlcRamirez and @peikko763 on Twitter.

As of Jan. 19, the month-to-date temperature anomaly across Antarctic is approx. -0.5C, making this the continents coldest first 3-or-so-weeks of Jan. since 1978 (solar minimum of cycle 20), according to research conducted by @peikko163 on Twitter, who also notes that the Southern Hemisphere as a whole is suffering anomalous January chills not seen since 2012.

But this chill of solar minimum isn’t just confined to the Southern Hemisphere either, the mercury ACROSS the planet is tumbling. In one month global temperatures dropped by a whopping 0.26C: from 0.53C above the 1981-2010 avg. in Nov. 2020 to just 0.27C above the avg. in Dec. 2020 (UAH). This drop was in spite of a warming Arctic–a region expected to “heat” during times of otherwise “global” cooling (more on that below).

The Sun appears to be sliding into its next Grand Solar Minimum cycle–a multidecadal spell of reduced solar output where the solar disc can be devoid of sunspots for months or even years at a time. The result on Earth’s climate will be one of violent swings between extremes due to a weakening of the jet streams: intense bursts of heat will linger in one area, while a teeth-chattering chill will dominate nearby, and then the regions will “switch” — it is this unpredictable chopping and changing that will hasten the failure of our modern food production systems: crops will fail, on a large scale, and famine could quickly ensue.

Overall, Earth’s temperature trends colder during a Grand Solar Minimum, as the Sun’s output sinks lower and lower (increased cloud nucleation being one likely forcing). However, not ALL regions experience the chill: as with the previous GSM (the Maunder Minimum 1645-1715), areas such as the Arctic, Alaska, and S. Greenland/N. Atlantic actually warmed while the rest of the planet cooled — NASA reveals the phenomenon in their Maunder Minimum temperature reconstruction map:

The Natural Warming Of The Global Oceans-Bob Tisdale

by P. Homewood, Jan 18, 3021 in NotaLotofPeopleknowThat


https://youtu.be/lmjaNO5DD_Q

Many of you will be familiar with the work of Bob Tisdale over the years, concerning the mechanism of ENSO (ie El Ninos and La Ninas) and its effects on climate.

His seminal series of videos, recorded in 2012 is still on YouTube, and is still highly relevant.

Above is Part 1, which is worth sticking with all the way through, but otherwise the first 8 minutes is definitely worth a watch. Nothing has effectively changed since 2012, and Bob’s conclusions are still relevant and valid.

As well as explaining what exactly drives El Ninos and La Ninas, he makes some significant points:

  1. Worldwide sea surface temperature trends since 1980 show no correlation with GHGs (see chart below)

  2. Instead they exhibit a series of step changes up, which follow the major El Nino events of 1982/83, 1987/88 and 1997/98

  3. Contrary to popular belief, global SSTs do not drop during La Nina episodes. This is because El Ninos transfer a vast amount of warm, subsurface water to the surface, where it remains during La Nina.

  4. Some of this warm water in the East Pacific finds its way into the West Pacific and Indian Oceans. But through a process called teleconnection, SSTs is the Atlantic, where there is no direct connection, also rise and exhibit the same step changes.

  5. Between major El Nino events, SSTs outside the East Pacific do not rise.

  6. In the East Pacific, there has been no trend increase in SST at all since 1980.


    ….

The IR absorptive characteristics of “greenhouse” gases–David Coe

by P. Homewood, Jan 17, 2021 in NotaLotofPeopleKnowThat


SUMMARY

Using well documented data on the infra-red absorption spectra of atmospheric gases it is a straight-forward process to infer the overall atmospheric IR absorption and from that the effective global average temperature. The simplest of atmospheric models has been used: the atmosphere is considered to be a uniform thin absorbing layer of gas. The results demonstrate clearly that the warming effect of the atmosphere is almost entirely due to the spectral absorption characteristics of CO2 and H2O. They are both exceptionally strong absorbers of infra-red radiation. It is however this strength which determines the characteristics of the earth’s temperature, and in particular its stability.

70% of the energy radiated from the earth is removed by a mixture of 0.1% H2O and 200ppm of CO2. This alone is sufficient to raise global temperatures from the chilly 255K of the estimated zero atmosphere condition to 284.3K, less than 4deg below current average temperatures. An estimation of the current atmospheric mixture of gases is calculated to deliver a global mean temperature of 286.8K close to the best estimate of 288K for that temperature. Further increases in both H2O and CO2 have relatively small impacts on temperatures. This is due simply to the fact that at current concentrations the spectra of both H2O and CO2 have effectively extracted most of the energy at wavebands corresponding to their molecular absorption spectra. There is little further energy to be extracted by adding more H2O and CO2. This results in climate sensitivity values of less than 0.5degC, in comparison to the 1.5 to 5 degC range quoted by the IPCC.

CO2 levels of 3000ppm will only raise temperatures by a further 1.5K. These temperature increases are in fact well within natural variations seen in the past, including the medieval warm period and the little ice age of some 300 years ago.

The possibility of positive feedback from water vapour is discounted by the simple fact that the H2O spectrum is incapable of absorbing significant further amounts of radiated energy and the modest increase in temperature due to increasing CO2 levels is unable to deliver any significant increase in H2O concentration due to the specific relationship of H2O saturation vapour pressure and temperature. It would take an increase in temperature of 10degC to double the mean H2O atmospheric concentration, and that doubling would only result in a temperature increase of 2degC.

The impact of other known “greenhouse’ gases, CH4 and N2O are also calculated from known IR spectra data. Their absorption spectra are swamped by H2O and CO2. The combined warming caused by current atmospheric concentrations will elevate temperature by only 0.2K and increasing concentrations by a factor of 10 will only result in a further temperature increase of 0.5K.

The “greenhouse effect” is dominated by the absorption spectrum of H2O with a little help from CO2. At current concentrations of both gases it is inconceivable that further increases in concentrations will lead to any significant warming. Increasing CO2 concentration to 3000ppm and doubling the mean H2O level to 2% would result in a global temperature increase of 3.4K.

In short, there is no climate emergency, at least due to “greenhouse gases”.

 The full paper can be read here:

co2-the-miracle-molecule-22637

See this Addendum

Committed warming and the pattern effect

by Nic Lewis, Jan 19, 2021 in ClilmateEtc.


Key points

  • The pattern effect is the dependence of outgoing radiation to space on the spatial pattern of surface warming.
  • A pattern effect, relative to that in equilibrium, can be caused both by evolution over time in the climate system’s response to forcing and by its internal variability.
  • The paper fails to distinguish between a historical period pattern effect that is forced, which will unwind very slowly, and one that is caused by internal variability, which can quickly unwind, causing rapid warming.
  • The forced pattern effect is very small in CAM5.3
  • The pattern effect found in the paper is greatly affected by being estimated during the hiatus.
  • The estimated post-hiatus unforced historical pattern effect is non-negligible in CAM5.3 when using the AMIP2 sea surface temperature dataset, as in the paper, but negligible when using the UK Met Office HadISST1 dataset.
  • The historical pattern effect is not robust; it varies hugely between models and SST datasets.
  • The paper’s claims about greater committed warming directly reflect its estimate of the size of the historical pattern effect.

Introduction

A new paper “Greater committed warming after accounting for the pattern effect” led by Chen Zhou  (Zhou et al.[1]) has recently been published in Nature Climate Change. Here is the accompanying press release.