by P. Gosselin, Apr 19, 2022 in NoTricksZone
A 2021 study appearing in Nature Communications by Buentgen et al reports on the results of a double-blind experiment of 15 different groups that yielded 15 different Northern Hemisphere summer temperature reconstructions. Each group used the same network of regional tree-ring width datasets.
What’s fascinating is that ll groups, though using the same data network, came up with a different result. When it comes to deriving temperatures from tree-rings, it has much to do with individual approach and interpretation. Sure we can follow the science, but whose results?
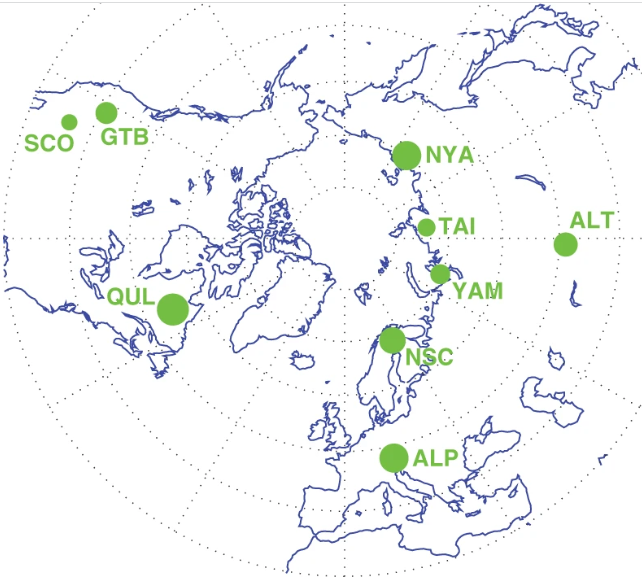
The 15 groups (referred to as R1–R15) were challenged with the same task of developing the most reliable NH summer temperature reconstruction for the Common Era from nine high-elevation/high-latitude TRW datasets (Fig. 1): Cropped from Figure 1, Buentgen et al
…
by Ole Humlum, April 2022 in GWPF
.pdf, GWPF Report 51, 54 pages
see also here and here
Contents
About the author ii General overview 2021 2
- Air temperatures 4Surface: spatial pattern 4 Lower Troposphere: monthly 6 Lower Troposphere: annual means 7 Surface: monthly 8 Surface: annual means 10 Error, consistency and quality 11 Surface versus lower Troposphere 14Lower Troposphere: land versus ocean 15 By altitude 16 Zonal air temperatures 17 Polar air temperatures 18
- Atmospheric greenhouse gases 19Water vapour 19 Carbon dioxide 20
- Ocean temperatures 22Recent surface temperature anomalies 22 By latitude 24 By depth 25 By region and depth 27 Ocean temperature net change 2004–2020 in selected sectors 28
- Ocean oscillations 31Southern Oscillation Index 31 Pacific Decadal Oscillation 31 Atlantic Multidecadal Oscillation 31
- Sea-level 33In general 33 From satellite altimetry 34 From tide gauges 35 Modelled for the future 36
- Snow and ice 39Global, Arctic and Antarctic sea ice extent 39 Northern Hemisphere snow cover extent 41
- Storms and wind 43Accumulated cyclone energy 43 Other storm and wind observations 45
- Written references 46
- Links to data sources 46
Review process 50 About the Global Warming Policy Foundation 50
…
La géologie, une science plus que passionnante … et diverse
Cropped from Figure 1, Buentgen et al
