by P. Gosselin, Apr 25, 2025 in NoTricksZone

Grok AI generated image.
Hans-Joachim Dammschneider has written a book about the climate history of the southern Harz region. In the historical weather data, he discovered climatic fluctuations that, according to the Intergovernmental Panel on Climate Change (IPCC), should not exist.
Long before industrial CO2 accumulated in the atmosphere, there were already alternating warm and cold phases.
Here is the book description:
The so-called Medieval Warm Period (MWP) has been the subject of scientific debate for years. It is not so much a question of whether this warm period actually took place in Europe, but rather how it took place. Was it a local phenomenon that was limited in time and predominantly restricted to Europe, or was it a period of intense climatic change that also had a global impact?
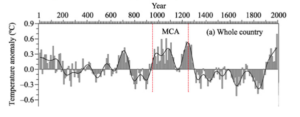
One thing is certain: from around 950 AD, there was a rise in temperature in Germany lasting at least 300 years, which resulted in a marked warm phase favorable to agriculture and life. However, from the beginning of the 14th century at the latest, this period was replaced by a relatively rapid drop in temperature and climatic turbulence in the direction of the so-called Little Ice Age.
In the early reports, the IPCC (1990, AR1) still devoted relatively much attention to the MWP. Over the years, however, this focus diminished, and in the most recent assessment (2021, AR6) little space was given to the Medieval Warm Period. Studies often even question whether it was a global phenomenon. However, a mapping of the available scientific publications (as of 2022) initiated by S. Lüning shows that the Warm Period certainly left evidence across continents.
…