The 2022 Hurricane Season

by P. Homewood (pdf), Feb 2023 in GWPF


Contents

About the author iii Executive summary v

  1. Introduction 1
  2. Observational methodologies 1
  3. US landfalling hurricanes 3
  4. Atlantic hurricanes 5
  5. Global trends 7
  6. What do the IPCC say? 8

Notes
About the Global Warming Policy Foundation 10

Executive summary

It is widely believed that hurricanes are getting worse as a consequence of climate change. This belief is fuelled by the media and some politicians, particularly when a bad storm occurs. This be- lief is reinforced because the damage caused by hurricanes is much greater nowadays, thanks to increasing populations in vulnerable coastal areas and greater wealth more generally.

But is this belief correct, or is it a misconception? This study has carefully analysed official data and assessments by hurricane scientists, and finds:

• 2021 and 2022 recorded the lowest number of both hurricanes and major hurricanes glob- ally for any two year period since 1980.

• The apparent long-term increase in the number of hurricanes since the 19th century has been due to changes in observational practices over the years, rather than a real increase.

• Data show no long-term trends in US landfalling hurricanes since the mid-19th century, when systematic records began, either in terms of frequency or intensity.

• Similarly, after allowing for the fact that many hurricanes were not spotted prior to the sat- ellite era, there are no such trends in Atlantic hurricanes either.

  • Globally there are also no trends in hurricanes since reliable records began in the 1970s.
  • Evidence is also presented that wind speeds of the most powerful hurricanes may now be overestimated in comparison to pre-satellite era ones, because of changing methods of meas- urement.

• The increase in Atlantic hurricanes in the last fifty years is not part of a long-term trend, but is simply a recovery from a deep minimum in hurricane activity in the 1970s, associated with the Atlantic Multidecadal Oscillation.

These findings are in line with those of hurricane scientists generally, as well as official bodies such as NOAA and the IPCC.

Early Cretaceous shift in the global carbon cycle affected both land and sea

by University of Nebraska-Lincoln, Feb 22, 2023 in ScienceDaily


Geologists doing fieldwork in southeastern Utah’s Cedar Mountain Formation found carbon isotope evidence that the site, though on land, experienced the same early Cretaceous carbon-cycle change recorded in marine sedimentary rocks in Europe. This ancient carbon-cycle phenomenon, known as the ‘Weissert Event’ was driven by large, sustained volcanic eruptions in the Southern Hemisphere that greatly increased carbon dioxide levels in the atmosphere and produced significant greenhouse climate effects over a prolonged time.

Scientific research in recent decades has confirmed that major changes in the global carbon cycle caused significant changes in the Earth’s atmosphere and oceans 135 million years ago, during the early Cretaceous Period. A range of questions remain about the details of climate change dynamics in that era. This new research, involving wide-ranging chemical and radioactivity-based analyses of rock strata in Utah’s Cedar Mountain Formation, helps fill in that knowledge gap by confirming that such carbon-cycle shifts were recorded on land in ancient North America.

The carbon cycle is one of Earth’s fundamental environmental phenomena, involving the ongoing transfer of carbon among the atmosphere, oceans and living organisms, as well as soils, sediments and rocks in the solid Earth. The cycle is crucial to biological processes for living things on land and sea. When large-scale changes in the cycle occur, they can produce major shifts in climate and the oceans’ biological conditions.

“We’re studying how the global carbon cycle has functioned in the past, how changes are recorded in the sedimentary rocks around the world,” said Joeckel, a professor in the School of Natural Resources at Nebraska. The environmental phenomena he and his colleagues analyzed “are exactly the kind of things we’re talking about today, as people increase the input of carbon dioxide into the atmosphere at a much-accelerated rate by burning fossil fuels.”

Joeckel, the Nebraska state geologist, headed the Utah fieldwork and organized the study, published as a peer-reviewed paper in a special February issue of the journal Geosciences.

Do European tree ring analyses indicate unusual recent hydroclimate?

by F. Bosse  & N. Lewis, Feb 23, 2023 in WUWT


Not really.

A recent paper (M. B. Freund et al 2023, MBF23 thereafter) in “Nature communication earth and environment” investigates the variability of the summer drought events since 1600. It uses the method of “stable isotope analyses C13/O18” to extend the “Standardised Precipitation-Evapotranspiration Index (SPEI) from 1950 to now back to 1600.

The paper describes and uses a multi proxy network over large parts of Europe (see Fig. 1 of MBF23) to reconstruct the history of summer droughts for a longer historic period. It finds interesting results about the dependency of those events on volcanos and solar forcing. It’s a worthwhile read and we were interested in whether the headline title is justified and likewise this claim in the Abstract:

“We show that the recent European summer drought (2015–2018) is highly unusual in a multi-century context…”

Thanks to the authors the used SPEI reconstruction annual data are available, so we were able to perform calculations to check these assertions.

An apparent first “confirmation” of the headline title of the paper appears in Figure 3a in MBH23:

Fig.1: A reproduction of Fig. 3a of MBH23. Annual European mean SPEI-data in blue/red, the low pass filter output is shown in black.

New geological study proves that the green energy movement is impossible to achieve

by R.A. Bishop, Feb 17, 2023 in LifeSite.AmericanThinker


The comprehensive study found that the current estimated metal reserves are woefully deficient in almost every category.  The table below lists base and rare earth metals requirements to build the new grid and E.V.s.  Deficits are yellow-highlighted.  For example, copper is an integral part of a high-voltage grid system, coming up short by a shocking 3.7 billion tons.  Can we dig enough open mile-deep ore pits to meet that shortfall?  Improbable.

Table 1 Below is the study’s table estimating the years to produce the required metals at the current production rates.  For example, lithium would take almost 10 millennia to achieve.  In addition, these scarce minerals must be mined, transported, and processed, relying exclusively on fossil fuels, which would create more carbon emissions and deplete hydrocarbon reserves.

It is Time to Bury the Grand Solar Minimum Myth

by J. Vinos, Feb 19, 2023 in WUWT


Fourteen years ago, a new climate myth was born. A grand solar minimum (GSM) was in the making that would not only reverse global warming but plunge the planet into a new Little Ice Age, surprising the warming alarmists and causing undue suffering. The time has come to bury that myth.

1. The origin of the myth

The deep solar minimum of 2008-2009 was a complete surprise to solar physicists. They did not know that solar activity could become so low because it had not occurred during the time of solar observations with modern instrumentation. In 2009, a solar scientist named Habibullo Abdussamatov published a paper in Russian in which he argued that the following years would see a major cooling based on the onset of a new GSM. His evidence was

  • The low solar activity of the then ongoing solar cycle (SC) minimum 23-24.

  • A bicentennial cycle in solar activity that supposedly decreased solar activity after 1600 and after 1800

  • The pause in global warming since 1998

Figure 1. From Abdussamatov 2009. “The Sun defines the climate”. Nauka i Zhizn, N1, pp. 34-42.

This prediction reached the West and became very popular, like any catastrophic prediction, actually. Articles about the arrival of a GSM proliferated on climate blogs, such as the one on WUWT: The ‘Baby Grand’ has arrived.

Other scientists, such as Livingston & Penn and de Jager & Duhau, joined Abdussamatov in 2009 in proposing the arrival of a GSM, though being more cautious about its climatic effects. It went so far as to threaten the global warming narrative at a time under assault from the Pause and Climategate. Thus, none other than Stefan Rahmstorf came to their defense saying that according to the models

“a new Maunder-type solar activity minimum cannot compensate for global warming caused by human greenhouse gas emissions.”

(Feulner & Rahmstorf 2010)

2. 2012-2015, the myth’s golden years

Microbes that co-operate contribute more carbon emissions

by Imperial College London, Feb 13, 2023 in ScienceDaily


Despite being small, microbes, and especially bacteria, contribute a lot to the global carbon cycle — the movement of carbon in various forms through nature. Its level in the atmosphere, and so its influence on climate change, is controlled by a series of sources and sinks, such as respiration and photosynthesis respectively.

Now, new research from Imperial College London and University of Exeter scientists has shown that, when warmed, bacterial communities that have matured to co-operate release more carbon dioxide (CO2) than communities that are in competition with each other.

The results are published in Nature Microbiology.

Co-author Dr Tom Clegg, who led the theory development from the Department of Life Sciences (Silwood Park) at Imperial, said: “Our findings have far-reaching implications given the significant contributions that bacterial communities make to the carbon cycle. We show that changes in bacterial species interactions can rapidly and substantially increase the carbon emissions from natural ecosystems worldwide.”

Bacteria — like humans — respire, taking in oxygen and releasing CO2. Of the many factors that control their level of respiration, temperature is particularly important.

Bacteria form communities of different species in all habitable environments, including in soil, puddles, and in our guts. When communities first form, the bacterial species are often ‘competitive’, each trying to get the best resources.

Climate Expert: What The Media Won’t Tell You About Tornadoes

by R. Pielke, Feb 13, 2023 in ClimateChangeDispatch


This is the latest post in an ongoing series, titled “what the media won’t tell you about…”, which is motivated by the apparent systemic inability of the legacy media to play things straight when it comes to extreme weather and disasters.

Climate change is real and important, but its importance is not an excuse for the pervasive climate misinformation found across the legacy media. [emphasis, links added]

Here are the previous installments in the series, which are among my most popular posts and which have gone unchallenged.

What the media won’t tell you about…

Today’s post focuses on U.S. tornadoes. This year so far has seen a lot of tornadoes — 178 were reportedthrough February 11th, the 2nd most since 2005 and well above the 2005-2022 mean of 66 to date.

Of course, nowadays wherever there is extreme weather, journalists rush to claim a connection to climate change no matter what the science actually says.

For instance, after a tornado outbreak last month, the Associated Press reported that the tornadoes had been “juiced by climate change.”

Similarly, The Washington Post said that in the past it was difficult to tie tornadoes to climate change but now, “science is accumulating to support the linkage.”

Neither reported any of the data and science I share below. So, let’s take a look

….

World’s Coral Reefs Not Declining, New Paper Reveals

by Dr. B. Peiser, Feb 8, 2023 in ClimateChangeDispatch


A new paperpublished by the Global Warming Policy Foundation refutes alarmist claims about the state of the world’s coral reefs.

According to the author, eminent reef scientist Peter Ridd, the official data show no signs of any long-term trends in reef health. [emphasis, links added]

Indeed, the best records – for Australia’s Great Barrier Reef – suggest that coral cover is at record highs.

Dr. Ridd said:

“The public is constantly told that reefs are being irreparably damaged by global warming, but bleaching events, about which there is so much doom-mongering, are simply corals’ natural response to changes in the environment. They are an extraordinarily adaptable lifeform, and bleaching events are almost always followed by rapid recovery.

Dr. Ridd suggests that rather than being seen as under threat from climate change, corals should actually be recognized as one of the organisms least likely to suffer harm in a warming world.

“Corals get energy from a symbiotic relationship with various species of algae. When environmental conditions change, they [coral] can rapidly switch to a different species that is better suited to the new conditions. This shapeshifting means that most setbacks they suffer will be short-lived.”

Dr. Ridd says that the real risks to reefs come from overfishingand pollution.

The GWPF invited responses to this paper from authors likely to dissent from its conclusions. None of the authors who were contacted accepted this invitation.

Peter Ridd: Coral in a Warming World: Causes for Optimism (pdf)

CMIP6 GCM Validation Based on ECS and TCR Ranking for 21st Century Temperature Projections and Risk Assessment

by N. Scafetta, Feb 3, 2023 in MDPI, Earth Science


Global climate models (GCMs) from the sixth Coupled Model Intercomparison Project Phases (CMIP6) have been employed to simulate the twenty-first-century temperatures for the risk assessment of future climate change. However, their transient climate response (TCR) ranges from 1.2 to 2.8 °C, whereas their equilibrium climate sensitivity (ECS) ranges from 1.8 to 5.7 °C, leading to large variations in the climatic impact of an anthropogenic increase in atmospheric CO2 levels. Moreover, there is growing evidence that many GCMs are running “too hot” and are hence unreliable for directing policies for future climate changes. Here, I rank 41 CMIP6 GCMs according to how successfully they hindcast the global surface warming between 1980 and 2021 using both their published equilibrium climate sensitivity (ECS) and transient climate response (TCR) estimates. The sub-ensemble of GCMs with the best performance appears to be composed of the models with ECS ranging between 1.8 and 3.0 °C (which confirms previous studies) and TCR ranging between 1.2 and 1.8 °C. This GCM sub-ensemble is made up of a total of 17 models. Depending on the emission scenarios, these GCMs predict a 2045–2055 warming of 1.5–2.5 °C compared to the pre-industrial era (1850–1900). As a result, the global aggregated impact and risk estimates seem to be moderate, which implies that any negative effects of future climate change may be adequately addressed by adaptation programs. However, there are also doubts regarding the actual magnitude of global warming, which might be exaggerated because of urban heat contamination and other local non-climatic biases. A final section is dedicated to highlighting the divergences observed between the global surface temperature records and a number of alternative temperature reconstructions from lower troposphere satellite measurements, three-ring-width chronologies, and surface temperature records based on rural stations alone. If the global warming reported by the climate records is overestimated, the real ECS and TCR may be significantly lower than what is produced by the CMIP6 GCMs, as some independent studies have already suggested, which would invalidate all of the CMIP6 GCMs.

Forest-Limit (Betula pubescens ssp. czerepanovii) Performance in the Context of Gentle Modern Climate Warming

by Kullman, Feb 6, 2023 in NoTricksZone


Claims the Swedish Scandes are unprecedentedly warm and tree-covered today “appear as large and unfounded exaggerations,” as the “climate and arboreal responses” of the last few decades “are still inside the frames of natural historical variation.” – Kullman, 2022 and Kullman, 2022a

Extensive birch forest fossils can be dated to the early- to mid-Holocene in northern Scandinavian regions, indicating these warmth-sensitive trees could exist in climates that are too cold for them to grow in today. This documents a much warmer period, “at least 3°C higher than during the past few decades,” 3000 to 10,000 years ago, or when CO2 was about 265 ppm (Kullman, 2022).

Contrary to modeler opinions, “there is little factual nourishment” to support modern projections that the Swedish Scandes will soon be returning to the subalpine birch forest climates of past millennia. The observed forest advancement in recent decades “is so small” that these modeling claims appear to be “unfounded exaggerations.”

Kullman, 2022

“In the southernmost Swedish Scandes, pine has already “leap-frogged” over receding the birch forest-limit (Kullman 2014, 2019). That scenario would mimic the arboreal landscape during the early Holocene and shift to a landscape unseen for thousands of years (cf. Blűthgen 1942; MacDonald et al. 2008, Macias-Fauria et al. 2012). During that epoch, summer temperatures are inferred to have been at least 3°C higher than during the past few decades.”
“At the landscape level, the obtained changes contribute to a greater and lusher landscape, in contrast to the dire conditions during the Little Ice Age, more than 100 years ago (Kullman 2010, 2015). Currently, there is little factual nourishment to flourishing projections stating that a major part of Swedish alpine areas is on verge of transformation to subalpine birch forest (e.g. Moen et al. 2004). Apparently, climate and arboreal responses are still inside the frames of natural historical variation, as inferred by several authors (e,g. Hammarlund et al. 2004; Bergman et al. 2005; Kullman 2013, 2017a, b; Kullman & Öberg 2018, 2020).”
“Given that the current relatively warm climate phase continues, the subalpine birch forest belt may eventually recede and give way to a subalpine pine belt. The obtained modest forest-limit advancement is so small that flourishing model simulations of extensive birch forest expansion over most of the current alpine tundra appear as large and unfounded exaggerations.”

Tree remnants (trunks, cones, roots, etc.) found at northern Sweden mountain sites 500 to 700 meters atop where the 21st century tree line ends imply the early-Holocene (~13,000 to 7000 years ago) climate was significantly warmer than today in this region (Kullman, 2022a).

The temperature lapse rate for the Swedish Lapland region is 0.6°C/100 m. Accounting for glacio-isostatic uplift, this tree line elevation implies surface air temperatures were 3.6°C higher than today during the Early Holocene.

Kullman, 2022a

….

India to use emergency law to maximise coal power output -sources

by S. Singh, Jan 30, 2023 in Reuters


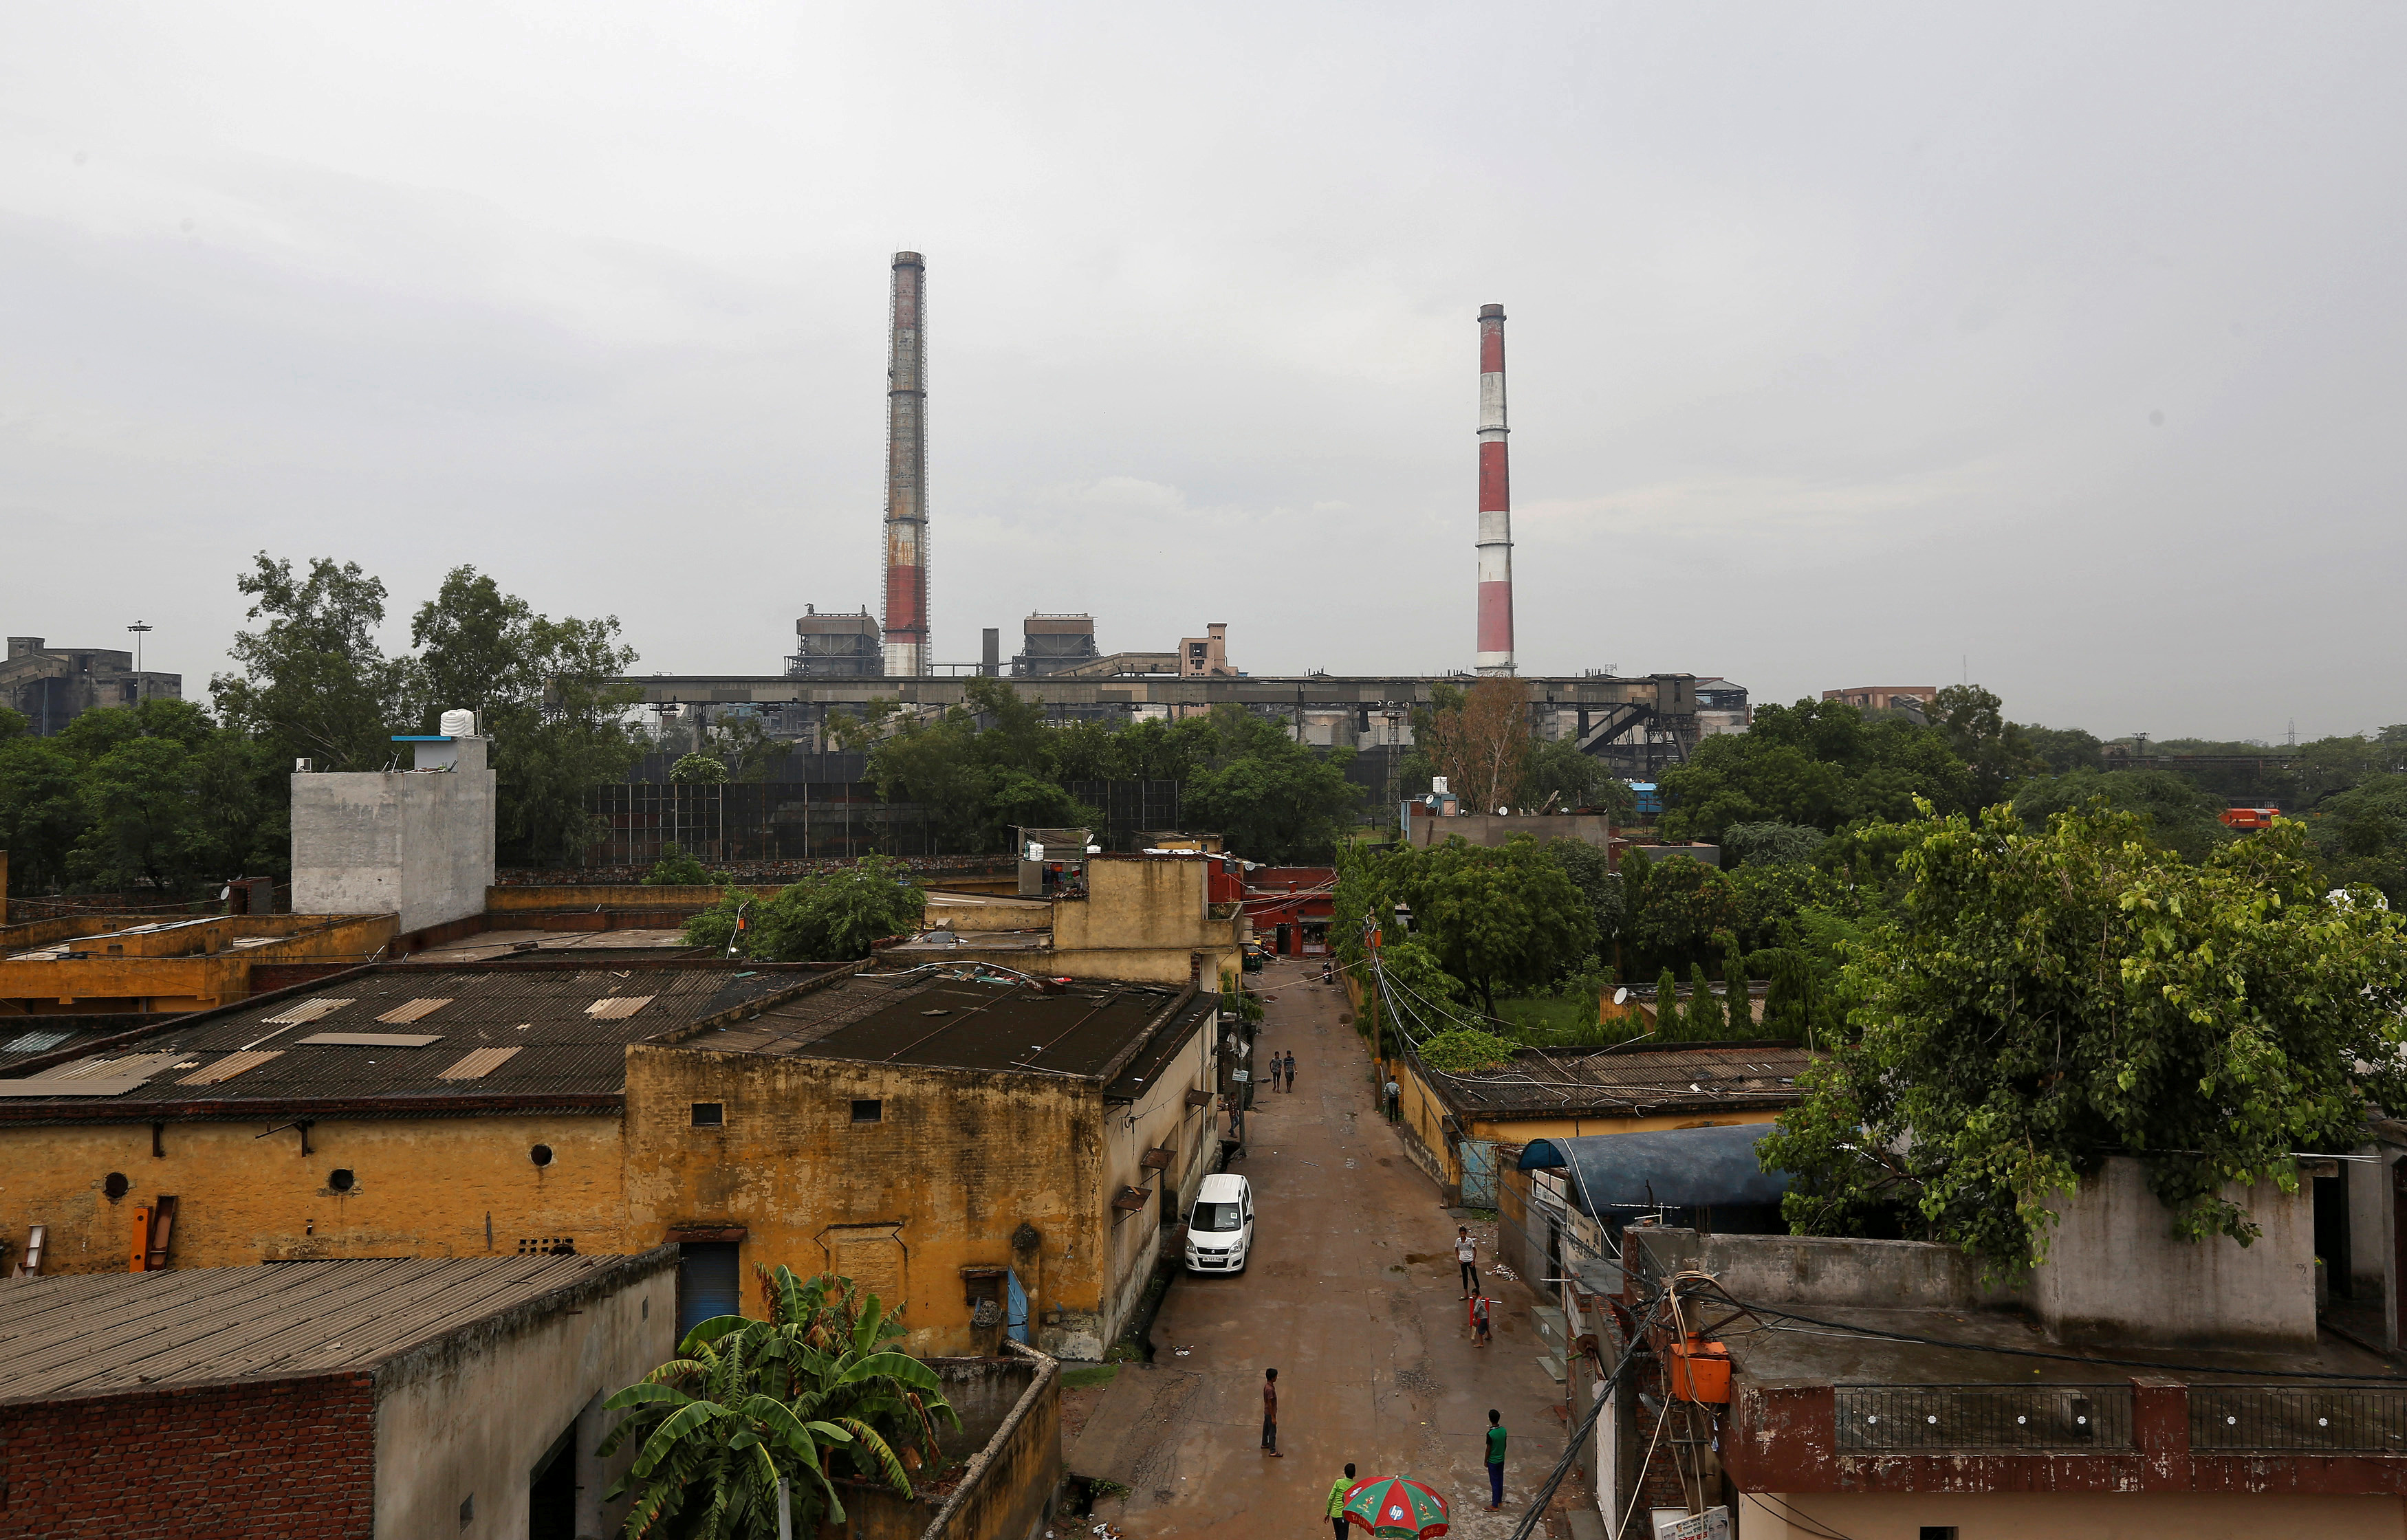
Chimneys of a coal-fired power plant are pictured in New Delhi
Chimneys of a coal-fired power plant are pictured in New Delhi, India, July 20, 2017. Picture taken July 20, 2017. REUTERS/Adnan Abidi

NEW DELHI, Jan 30 (Reuters) – India plans to use an emergency law next month to force power plants that run on imported coal to maximise output, two government sources told Reuters on Monday, in preparation for expected record consumption this summer.

Many Indian coal-fired plants, including those those owned by Adani Power (ADAN.NS) and Tata Power (TTPW.NS) in India’s western Gujarat state, have not operated at full capacity in the recent years because they have found it difficult to compete with power generated from cheap domestic coal.

UAH Global Temperature Update for January, 2023: -0.04 deg. C

by Dr R. Spencer, Feb 2, 2023 in WUWT


The Version 6 global average lower tropospheric temperature (LT) anomaly for January 2023 was -0.04 deg. C departure from the 1991-2020 mean. This is down from the December 2022 anomaly of +0.05 deg. C.

The linear warming trend since January, 1979 now stands at +0.13 C/decade (+0.11 C/decade over the global-averaged oceans, and +0.18 C/decade over global-averaged land).

Various regional LT departures from the 30-year (1991-2020) average for the last 13 months are:

YEAR MO GLOBE NHEM. SHEM. TROPIC USA48 ARCTIC AUST
2022 Jan +0.03 +0.06 -0.00 -0.23 -0.13 +0.68 +0.10
2022 Feb -0.00 +0.01 -0.01 -0.24 -0.04 -0.30 -0.50
2022 Mar +0.15 +0.27 +0.03 -0.07 +0.22 +0.74 +0.02
2022 Apr +0.26 +0.35 +0.18 -0.04 -0.26 +0.45 +0.61
2022 May +0.17 +0.25 +0.10 +0.01 +0.59 +0.23 +0.20
2022 Jun +0.06 +0.08 +0.05 -0.36 +0.46 +0.33 +0.11
2022 Jul +0.36 +0.37 +0.35 +0.13 +0.84 +0.55 +0.65
2022 Aug +0.28 +0.31 +0.24 -0.03 +0.60 +0.50 -0.00
2022 Sep +0.24 +0.43 +0.06 +0.03 +0.88 +0.69 -0.28
2022 Oct +0.32 +0.43 +0.21 +0.04 +0.16 +0.93 +0.04
2022 Nov +0.17 +0.21 +0.13 -0.16 -0.51 +0.51 -0.56
2022 Dec +0.05 +0.13 -0.03 -0.35 -0.21 +0.80 -0.38
2023 Jan -0.04 +0.05 -0.14 -0.38 +0.12 -0.12 -0.50

The full UAH Global Temperature Report, along with the LT global gridpoint anomaly image for January, 2023 should be available within the next several days here.

The global and regional monthly anomalies for the various atmospheric layers we monitor should be available in the next few days at the following locations:

Lower Troposphere:

http://vortex.nsstc.uah.edu/data/msu/v6.0/tlt/uahncdc_lt_6.0.txt

Mid-Troposphere:

http://vortex.nsstc.uah.edu/data/msu/v6.0/tmt/uahncdc_mt_6.0.txt

Tropopause:

http://vortex.nsstc.uah.edu/data/msu/v6.0/ttp/uahncdc_tp_6.0.txt

Lower Stratosphere:

http://vortex.nsstc.uah.edu/data/msu/v6.0/tls/uahncdc_ls_6.0.txt