by K. Richard, Mar 13, 2025 in NoTricksZone
“Until now, the origin of the climate dynamics of the Central Andes during the last millennium has been speculative. On the basis of statistical evidence, we have identified solar variability as its origin.” – Schittek et al., 2025
In a new study, scientists have determined:
1) The Little Ice Age (LIA) was a global-scale cold event.
2) Southern Hemisphere (Peruvian Andes) climate (precipitation) variations are robustly linked to variations in solar activity over the last 1,000 years.
3) The modern (1900s-2000s) and Medieval Climate Anomaly climate warmth are associated with reduced rainfall, and the LIA colder temperatures are associated with more precipitation.
“…the LIA was a global event, marked by advance of glaciers worldwide.”
“Solar irradiation is the primary driver for all climate circulation processes on Earth. Evidence for a direct solar influence on the Earth’s climate has been growing.”
“Our study reveals evidence that precipitation changes in the south-eastern Peruvian Andes are linked to variations in solar activity during the LIA [Little Ice Age].”
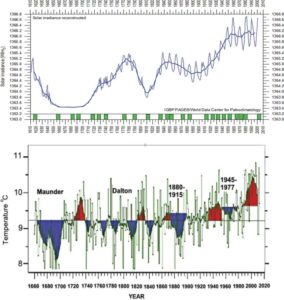
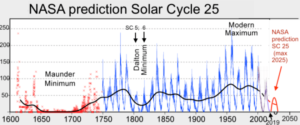
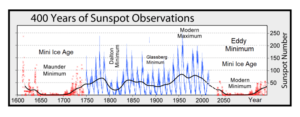
“Several studies attribute climate cooling during the LIA to solar forcing, particularly during the Wolf, Spörer, Maunder, and Dalton Minima.”
“The position of the ITCZ [Intertropical Convergence Zone] is robustly dependent on the interhemispheric temperature gradient triggered by solar forcing.”
…