The State of the Great Barrier Reef 2024(.pdf)

by P. Ridd, Mar 2204, in AustralianEnvironmentFoundation


Table of Contents
Chapter 1: What is the Great Barrier Reef? 4
Chapter 2: The Great Barrier Reef and its coral: The Data. 11
2.1 The area and number of coral reefs on the Great Barrier Reef 11
2.2 Coral Cover: the amount of coral on the Great Barrier Reef. 11
2.3 Coral growth rates (calcification) 19
Chapter 3: Hot-water ‘bleaching’ on the Great Barrier Reef 23
3.1 Introduction 23
3.2 Are bleaching events a new phenomenon? 23
3.3 Corals and their algal friends. 25
3.4 Bleaching is not usually lethal: it is a survival strategy. 27
3.5 Analysis of past GBR bleaching events. 29
3.6: Excuses for Failed Bleaching Predictions 31
3.7 Corals Like it Hot. 33
Chapter 4: Impact of agriculture on coral 35
4.1 Introduction. 35
4.2 Water flushing time of the GBR. 36
4.3: Nutrient ‘pollution’. 38
4.4 Sediment ‘pollution’. 42
4.5 Pesticides. 49
Chapter 5: Stretching the GBR to the coast. 54
5.1 Introduction. 54
5.2 Inshore Reefs. 54
5.3 Mangrove Swamps. 61
5.4 Seagrass beds. 63
5.5 Coastal Freshwater ecosystems. 68
5.6 Importance of Coastal ecosystems to the Great Barrier Reef. 69
Chapter 6 Summary and conclusions 71
Appendix Usefulness of coral cover measurements. 74
About the Author 79
Acknowledgments

Calls for inquiry into Climate Change Committee

by P. Homewood, Mar 11, 2024 in NotaLotofPeopleKnowThat


More New Studies Indicate There Has Been No Climate-Induced Precipitation Trend Since The 1800s

by K. Richard, Mar 11, 2024 in NoTricksZone


CO2-induced global warming was supposed to intensify the hydrological cycle and extreme precipitation. It hasn’t.

New research (Mitchell and Knapp, 2024) at a southeastern United States study site indicates there has been no significant trend in either total precipitation or intense rainfall events (IRE) over the last 250 years (1770-2020).

However, there was more IRE precipitation from 1936-1959 than from 1960-2020. In fact, the most recent 60 years has the lowest record of extreme precipitation during the study, with averages of 81.20 mm for 1770–1935, 230.45 mm for 1936–1959, but just 168.27 mm during 1960–2020.

No, CNN, Climate Change Is Not Driving Doomsday Glacier’s Decline

by S. Burnett, Mar 5, 2024 in ClimateChangeDispatch


A CNN story implies that supposed human-caused climate change is causing the Thwaites Glacier to melt, causing sea level rise. This is false.

Data show that Antarctica has not been warming. Also, the study CNN cited itself shows the glacier has declined dramatically and recovered repeatedly in the past, all without human contribution, suggesting the present decline is part of a natural cycle. [emphasis, links added]

At approximately the size of Florida, the Thwaites Glacier is the broadest glacier on Earth. The Thwaites Glacier is often referred to as the “Doomsday Glacier,” based on the belief that a complete collapse would cause as much as two feet of sea level rise over time.

The CNN story, “The ‘Doomsday Glacier’ is rapidly melting. Scientists now have evidence for when it started and why,” discusses a new study published in the journal Proceedings of the National Academy of Sciences, which determined when the present decline began.

“By analyzing marine sediment cores extracted from beneath the ocean floor, researchers found the glacier began to significantly retreat in the 1940s, likely kicked off by a very strong El Niño event — a natural climate fluctuation which tends to have a warming impact,” reports CNN.

“Since then, the glacier has been unable to recover, which may reflect the increasing impact of human-caused global warming, according to the report.”

Although the commencement of … Thwaites’ decline may now have been determined, any prognostications about future trends for the glacier are pure speculation, unsupported by historical evidence or data about present Antarctic trend.

The underlying reports determined that the Thwaites glacier’s decline commenced in the 1940s probably prompted by a powerful El Nino event that warmed the abutting waters.

….

The Anthropocene is dead. Long live the Anthropocene

by P. Voosen, Mar 5, 2024 in AAASScience


For now, we’re still in the Holocene.

Science has confirmed that a panel of two dozen geologists has voted down a proposal to end the Holocene—our current span of geologic time, which began 11,700 years ago at the end of the last ice age—and inaugurate a new epoch, the Anthropocene. Starting in the 1950s, it would have marked a time when humanity’s influence on the planet became overwhelming. The vote, first reported by The New York Times, is a stunning—though not unexpected—rebuke for the proposal, which has been working its way through a formal approval process for more than a decade.

“The decision is definitive,” says Philip Gibbard, a geologist at the University of Cambridge who is on the panel and serves as secretary-general of the International Commission on Stratigraphy (ICS), the body that governs the geologic timescale. “There are no outstanding issues to be resolved. Case closed.”


A New 1787-2005 Temperature Reconstruction Determines The Coldest 50-Year Period Was 1940-1993

by K. Richard, Mar 4, 2024 in NoTricksZone


The warmest 50-year period in northeastern China occurred from 1844-1893.

Li et al., 2024

“Compared with single years, in general, high or low temperatures that persist for many years will more significantly affect the growth of trees [30]. When we defined years with T12-1 ≥ −10.73 °C (Mean + 1σ) and T12-1 ≤ −12.61 °C (Mean − 1σ) as extreme warm years and cold years, respectively, the reconstruction for the period of 1787–2005 contained 31 cold years and 36 warm years (Table 4). The extreme cold/warm events lasting for three or more consecutive years were discovered in 1965–1967 and 1976–1978/1791–1798, 1844–1849 and 1889–1891. An 11-year smoothing average of the reconstructed T12-1 series was performed to reveal multi-year and interdecadal variations and to detect the several prolonged cold and warm periods (Figure 5d). After smoothing with an 11-yr moving average, cold periods occurred in 1822–1830 (mean T12-1 = −12.7 °C) and 1957–1970 (mean T12-1 = −12.7 °C), while a warm period occurred in 1787–1793 (mean T12-1 = −10.4 °C) (Figure 5d). Rapid and sustained cooling was observed in the reconstructed series in the years 1790–1826 (T12-1 range −10.3 °C to −12.8 °C, mean = −12.0 °C) and 1939–1969 (T12-1 range −11.6 °C to −12.7 °C, mean = −12.1 °C), where the rates of cooling were about 0.067 °C/year and 0.035 °C/year, respectively (Figure 5d). The two cooling events may be due to the decrease in solar activity [48,49,50]. Using a 50-year time scale, the highest temperature occurring during 1787–2005 was from 1844 to 1893 (T12-1 range −12.79 °C to −9.41 °C, mean = −11.15 °C), similar results were also obtained by Zhu et al. and Jiang et al., while the lowest temperature was from 1940–1993 (T12-1 range −13.57 °C to −10.26 °C, mean = −12.13 °C) (Figure 5d) [33].”

How Geology And Rocks Tell The Story Of Earth’s Climatic Past

by. J. Duhamel, Mar 4, 2024 in ClimateChangeDispatch


I am a geologist which means I have rocks in my head and some of those rocks have recorded the climate history of Earth. Here is their story.

We will start with the big picture.

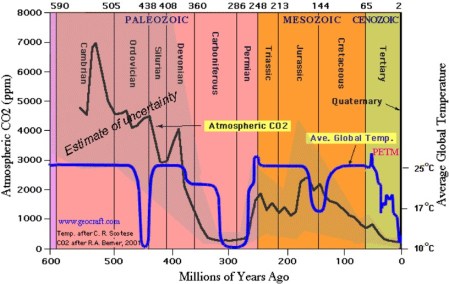
The graphic below [after the jump] shows the estimated temperature and atmospheric carbon dioxide (CO2) content for the past 600 million years. [emphasis, links added]

The blue line is the estimated temperature; the black line is the estimated CO2 content of the atmosphere.

Notice that for much of the past 600 million years, the temperature has been about 12°C warmer than it is now and life has flourished. (Note that the climate crazies claim that if the global temperature increases by 2°C above present, we will die.)

CO2 temps graph

Click to enlarge

The dips in the temperature curve are ice ages. Ice ages have occurred on a cycle of about 145 million years. Ice ages consist of glacial epochs and warmer interglacial periods. We are now in an interglacial period. (In the popular vernacular, glacial epochs are often called “ice ages.”)

The glacial epoch cycle happens whenever our solar system, in its travels around the center of our galaxy, goes through some spiral arms of the galaxy with very dense clusters of stars that bombard the Earth with more cosmic rays, which produce more clouds and other effects in the atmosphere, which limit the amount sunlight that gets to Earth’s surface.

Carbon NetZero: A Ridiculous Solution to an Imaginary Problem VIDEO

Dr. Patrick Moore, March 4, 2024 in FriendsofScience  


VIDEO 57’54”

3 900 vues 28 févr. 2024
https://www.youtube.com/watch?v=GlcAKE04YvM

Carbon NetZero: A Ridiculous Solution to an Imaginary Problem – Dr. Patrick Moore presents a bit of his personal history as a Greenpeace Warrior, and now a compendium of his work as a warrior for common sense on climate and environmental problems. Drawing on some of the work from his book “Fake and Invisible Catastrophes and Threats of Doom,” Dr. Moore exposes many of these climate and environmental myth

Warming Earth Has Changed U.S. Hardiness Zones

by  K. Hansen, March 4, 2024 in WUWT


Several times I have had readers at WUWT ask in comments:  “If the climate is changing, why haven’t the planting zone maps changed?”

Well, they have and they do.  The U.S. Department of Agriculture issues a new U.S.D.A. “Plant Hardiness Zone Map” periodically.  A new version of the map was just released on Nov. 15, 2023.  I became aware of it because my wife is an avid gardener and follows our local agricultural County Cooperative Extension news.

When she followed the link to the new Plant Hardiness map and checked our very local area, she was surprised to see that it had “warmed” here by 5°F.   Here is the bit of the page she was looking at:

She was a bit perplexed by this news, as we have been having not “hot” years but cooler years recently. It took me a minute to sort through it to see that the drop down was not clear on what temperature change they were talking about.  That temperature change elevated us one half a zone from zone 5b to zone 6a.


EXCLUSIVE: A Third of U.K. Met Office Temperature Stations May Be Wrong by Up to 5°C, FOI Reveals

by C. Morrison, March 1, 2024 in TheDailySceptic


Nearly one in three (29.2%) U.K. Met Office temperature measuring stations have an internationally-defined margin of error of up to 5°C. Another 48.7% of the total 380 stations could produce errors up to 2°C, meaning nearly eight out of ten stations (77.9%) are producing ‘junk’ or ‘near junk’ readings of surface air temperatures. Arguably, on no scientific basis should these figures be used for the Met Office’s constant promotion of the collectivist Net Zero project. Nevertheless, the state-funded operation frequently uses them to report and often catastrophic rises in temperature of as little as 0.01°C.

Under a freedom of information request, the Daily Sceptic has obtained a full list of the Met Office’s U.K. weather stations, along with an individual class rating defined by the World Meteorological Office. These CIMO ratings range from pristine class 1 and near pristine class 2, to an ‘anything goes’ or ‘junk’ class 5. The CIMO ratings penalise sites that are near any artificial heat sources such as buildings and concrete surfaces. According to the WMO, a class 5 site is one where nearby obstacles “create an inappropriate environment  for a meteorological measurement that is intended to be representative of a wide area”. Even the Met Office refers to sites next to buildings and vegetation as “undesirable”. It seems class 5 sites can be placed anywhere, and they come with a WMO warning of “additional estimated uncertainties added by siting up to 5°C”; class 4 notes “uncertainties” up to 2°C, while class 3 states 1°C. Only 13.7%, or 52 of the Met Office’s temperature and humidity stations come with no such ‘uncertainty’ warnings attached.

The above graph shows the percentage totals of each class. Class 1 and 2, identified in green, account for just 6.3% and 7.4% of the total respectively. Class 3 identified as orange comes in at 8.4%. The graph shows the huge majorities enjoyed by the darkening shades of red showing classes 4 and 5. It is possible that the margins of error identified for classes 3, 4 and 5 could be a minus amount – if for instance the measuring device was sited in a frost hollow – but the vast majority are certain to be pushed upwards by heat corruptions.


Europe’s Consensus On Climate Is Crumbling

by W. Münchau, Feb 29, 202 in ClimateChangeDispatch


At stake in the European elections in June this year will be everything that defines the modern EU: a large volume of net zero legislation, a values-based foreign policy, and ever-more intrusive business regulation.

Polls suggest the centrist majority that has supported these policies is growing slimmer. [emphasis, links added]

Ursula von der Leyen [pictured above] has been the quintessential representative of that majority. Born in Brussels, German by nationality, proposed by France, she was the perfect candidate for European Commission president in late 2019.

Now she is seeking a second term. Whether she will succeed will depend to a large extent on whether the centrist four-party coalition that supported her in 2019 will hold.

All over Europe, we are now seeing a backlash against the kind of policies the Von der Leyen Commission represents.

The far right is part of that response, but the main political shift has been inside Von der Leyen’s own political group, the European People’s Party (EPP), of which the German CDU/CSU is the largest member.

This backlash follows one of the most hectic political phases in recent EU history. When Covid struck in early 2020, Von der Leyen was instrumental in setting up the EU’s recovery fund to help countries deal with the economic consequences of the pandemic.

Then came the Green Deal, a hefty tranche of legislation on renewable energy, land use, forestry, energy efficiency, emission standards for cars and trucks, and a directive on energy taxes.

There was also a tightening of standards on pesticides, air quality, water pollution, and wastewater.

Farmers are resisting this program because it affects their livelihoods. Industrialists, too, are unhappy. A big part of the Green Deal was its industrial policy; the flagship legislation was the Net Zero Industry Act.

The industry used to be the EU’s strongest supporter.

But with the new laws came new bureaucracy: now, all EU-funded investment must include a green component of at least 30 percent, while a carbon border adjustment mechanism, to take effect in 2026, will penalize imports that do not meet EU carbon-emission standards. Together, EU legislation in the last few years amounts to a near-total corporate regime change.

Compliance with some regulations is virtually impossible for companies without dedicated legal teams. It is going to get worse.

Under discussion right now is a supply-chain law that would make European companies responsible for human rights abuses in their supply chain – including the suppliers of their suppliers.

I expect that the hyperactive phase of this green agenda will end with the elections in June. Some of it might even go into reverse. I am even starting to doubt whether the EU will ever enforce the 2035 target for phasing out fossil-fuel-driven cars.

This is an industrial-policy disaster in the making because Europe’s carmakers are having trouble selling their electric cars.

La géologie, une science plus que passionnante … et diverse