
by Les Johnson, August 23, 2019 in WUWT
We are told that Amazon fires are at record levels right now. This is a blatant lie. The only “record” is that Amazonian fires have DECREASED over the “record”.
This (is) what the data actually looks like, to August 22. Yes, its updated daily.
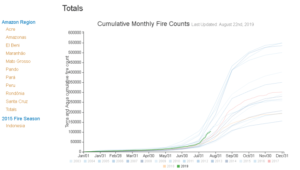
This comes from a wonderful site, https://www.globalfiredata.org/forecast.html#elbeni
It uses NASA MODIS data, from the Terra and Aqua satellites, and is updated daily. By going to the website, you can look at individual regions in the Amazon, or as I have done, look at the totals for the Amazon. This site also has global data, but I am only looking at the Amazon region here.
The Interactive Graphs are very informative. Hovering the cursor over the graph will show the data at that point.
You can highlight individual years, by clicking on a year in the legend at the bottom of the graph. That year remains bright, while the rest are dimmed. Using Eyeball Mark 1 Trend Indicator (EBM1TI), 2019 is slightly high, but not at record levels. Not even close.
One thing I saw by looking at each year, was a rough pattern – one or two bad years, one or two years at much lower levels, then a bad year. This pattern is there until 2010. 2010 was the last “bad year”. Levels since 2010 have been 1/2 or less of the “bad years”. The old pattern has been broken.
…
See also here