by DMI (Danish Meterological Institute), July 2017
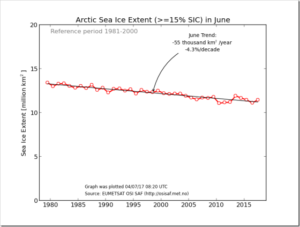
The graphic shows the mean September sea ice extent on the northern hemisphere. The plotted values correspond approximately to the sea ice area that ‘survived’ the summer melt in the respective years
The graph illustrates a decreasing trend in sea ice extent since 1978, with annual variations of occationally more than 1 million square kilometres. The 2012 sea ice minimum extented set a new minimum record.
See also here