Over at Dr. Curry’s excellent website, she’s discussing the Red and Blue Team approach. If I ran the zoo and could re-examine the climate question, I’d want to look at what I see as the central misunderstanding in the current theory of climate.
This is the mistaken idea that changes in global temperature are a linear function of changes in the top-of-atmosphere (TOA) radiation balance (usually called “forcing”).
I thought I’d take a moment from my R&R to write about all the hullabaloo surrounding the calving of the large iceberg off the Larsen C ice shelf in Antarctica. First, a few of the headlines:
Progressive bottom melting and break-up of West Antarctica’s seafloor hugging Larsen Ice Shelf is fueled by heat and heated fluid flow from numerous very active geological features, and not climate change.
A new opinion poll of 10,000 European citizens reveals majority of Europeans reject the claim that climate change is mainly or entirely caused by humans.
For the last few decades, questions about the causes and impacts of climate change have dominated the climate debate. The IPCC and many climate scientists have been claiming relentlessly that the global warming trend since the second half of the 20th century is mainly if not entirely man-made, i.e. as a result of anthropogenic greenhouse gas emissions. This dogma is habitually claimed to be the global climate consensus.
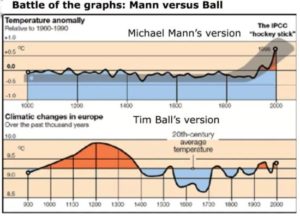
When considering the scale of temperature changes that alarmists anticipate because of Man-made Global Warming and their view of the disastrous effects of additional Man-made Carbon Dioxide emissions in this century, it is useful to look at climate change from a longer term, century by century and even on a millennial perspective.
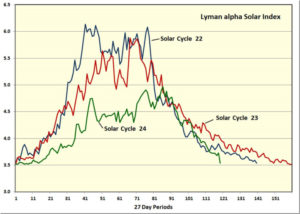
This recent post was on the fact that the Sun’s EUV emissions had fallen to solar minimum-like levels well ahead of solar minimum. The implication was that the Solar Cycle 24/25 minimum was either going to be very deep and prolonged, or that Solar Cycle 24 would be very short, which in turn would be strange for a weak cycle.
It’s official. According to a new paper published in the journal Scientific Reports,Greenland has been cooling slightly since 2005.
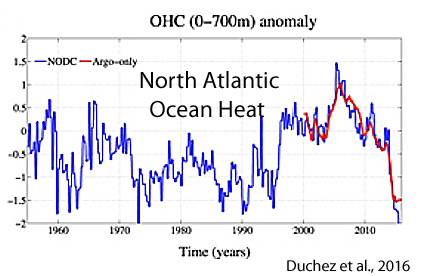
This trend development may be a harbinger of what may be in store for the coming years. Shifts in North Atlantic temperatures typically lead changes in the Arctic by a few years. And throughout the North Atlantic, rapid cooling has been underway since 2005, plunging below the levels reached in the 1950s
CBS have a report on rising sea levels at Tangier Island, in Chesapeake Bay here
The video is worth watching. The CBS reporter makes the usual attempts to blame it on “climate change”, but the locals know too much to fall for that old pony.
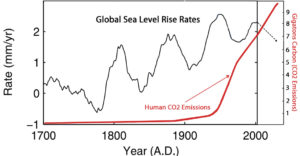
They know that sea levels have been rising, and land eroding, since 1850.
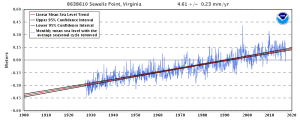
And they are right. Tide gauges in the area, such Sewell Point, Norfolk, confirm that sea levels have been steadily rising for a long time, long before recent rises in emissions of CO2.
Much of Greenland has been colder-than-normal for the year so far and has had record or near record levels of accumulated snow and ice since the fall of last year. The first week of this month was especially brutal in Greenland resulting in the record low July temperature and it also contributed to an uptick in snow and ice extent – despite the fact that it is now well into their summer season.
A new paper in Science Advances by Cristian Proistosescu and Peter Huybers “Slow climate mode reconciles historical and model-based estimates of climate sensitivity” (hereafter PH17) claims that accounting for the decline in feedback strength over time that occurs in most CMIP5 coupled global climate models (GCMs), brings observationally-based climate sensitivity estimates from historical records into line with model-derived estimates. It is not the first paper to attempt to do so, but it makes a rather bold claim and, partly because Science Advances seeks press coverage for its articles, has been attracting considerable attention.
Methane emissions influence but do not undermine the environmental case for gas. If the industry can build on the progress to date and deliver a clearer picture on the level of emissions and actions to address them, the arguments for gas displacing coal in power generation and oil products in transport become much stronger.
The climate consensus now has two derogation levels for those who disagree. Climate ‘contrarians’ like Bjørn Lomborg disagree about mitigation policies. Climate ‘deniers’ like Judith Curry disagree about the underlying climatology
The IPCC carbon budget concludes that changes in atmospheric CO2 are driven by fossil fuel emissions on a year by year basis. A testable implication of the validity of this carbon budget is that changes in atmospheric CO2 should be correlated with fossil fuel emissions at an annual time scale net of long term trends. A test of this relationship with insitu CO2 data from Mauna Loa 1958-2016 and flask CO2 data from twenty three stations around the world 1967-2015 is presented. The test fails to show that annual changes in atmospheric CO2 levels can be attributed to annual emissions.
A new study found adjustments made to global surface temperature readings by scientists in recent years “are totally inconsistent with published and credible U.S. and other temperature data.”
“Thus, it is impossible to conclude from the three published GAST data sets that recent years have been the warmest ever – despite current claims of record setting warming,” according to a study published June 27 by two scientists and a veteran statistician.
by Ben Wolfgang, July 5, 2017, in The Washington Times
The biggest critics of President Trump’s decision to withdraw from the Paris climate accord are also the world’s biggest hypocrites on energy policy, top environmental groups charged Wednesday in a report that found many top nations’ rhetoric on cutting emissions doesn’t line up with how and where they spend their money.
The key finding: The G-20 nations spend roughly four times as much in public financing for fossil fuels as they do supporting renewable energy sources such as wind and solar. The report examines loans, grants, guarantees, insurance and other types of public finance offered either by the governments, government-owned financial institutions and credit agencies, and multilateral groups made up of G-20 countries.
Penn State climate scientist, Michael ‘hockey stick’ Mann commits contempt of court in the ‘climate science trial of the century.’ Prominent alarmist shockingly defies judge and refuses to surrender data for open court examination
The BOM got caught this week auto-adjusting cold extremes to be less cold. Lance Pidgeon of the unofficial BOM audit team noticed that the thermometer at Goulburn airport recorded – 10.4°C at 6.17am on Sunday morning, but the official BOM climate records said it was -10.0°C. (What’s the point of that decimal place?) Either way this was a new record for Goulburn in July. (The previous coldest ever July morning was -9.1°C. The oldest day in Goulburn was in August 1994 when it reached -10.9°C).
“End-Coal” Global Coal Tracker does a magnificent job of showing how essential coal is around the world, and which countries are pathetically backwards in developing new coal plants. It’s probably not what the “CoalSwarm” team was hoping to achieve, but this map is a real asset to those of us who want to show how tiny Australia’s coal fired assets are compared to the rest of the world
We show that variations in ocean temperature in the high latitude North Atlantic and Nordic Seas are reflected in the climate of northwestern Europe and in winter Arctic sea ice extent. Statistical regression models show that a significant part of northern climate variability thus can be skillfully predicted up to a decade in advance based on the state of the ocean.Particularly, we predict that Norwegian air temperature will decrease over the coming years, although staying above the long-term (1981–2010) average. Winter Arctic sea ice extent will remain low but with a general increase towards 2020.
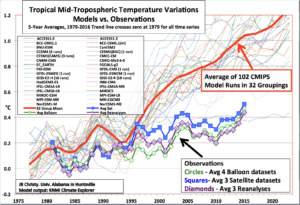
The observed internal variability so estimated exhibits a pronounced multidecadal mode with a distinctive spatiotemporal signature, which is altogether absent in model simulations. This single mode explains a major fraction of model-data differences over the entire climate index network considered; it may reflect either biases in the models’ forced response or models’ lack of requisite internal dynamics, or a combination of both.
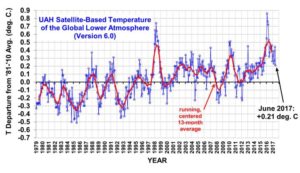
Lowest global temperature anomaly in last 2 years (since July, 2015)
The Version 6.0 global average lower tropospheric temperature (LT) anomaly for June, 2017 was +0.21 deg. C, down from the May, 2017 value of +0.44 deg. C
The CO2 safe limit for US Navy submarines is 8,000 ppm (Dotted red line)
The CO2 safe limit for the space station is 5,000 ppm (Dotted blue line)
A line depicting the gradual doubling of CO2 is near the bottom of the graph
The minimum atmospheric CO2 requirements to sustain plant growth is 150 ppm (Dotted green line)
In addition, atmospheric CO2 has been as high as 7,000 ppm approximately 550 million years ago, and as high as 2,000 ppm as recently as 150 million years ago. (Also here in French)
What the graph clearly shows is how close mankind came to extinction when atmospheric CO2 levels dropped to 183 ppm during the last ice age.
La géologie, une science plus que passionnante … et diverse
