by Willis Eschenbach, January 8, 2019
As a result of a tweet by Steve McIntyre, I was made aware of an interesting dataset. This is a look by Vinther et al. at the last ~12,000 years of temperatures on the Greenland ice cap. The dataset is available here.
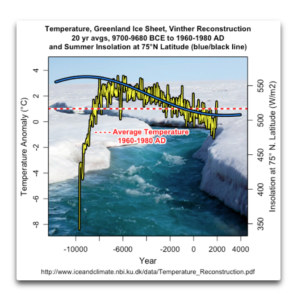
Figure 1 shows the full length of the data, along with the change in summer insolation at 75°N, the general location of the ice cores used to create the temperature dataset.

Figure 1. Temperature anomalies of the Greenland ice sheet (left scale, yellow/black line), and the summer insolation in watts per square metre at 75°N (right scale, blue/black line). The red horizontal dashed line shows the average ice sheet temperature 1960-1980.
I’ll only say a few things about each of the graphs in this post. Regarding Figure 1, the insolation swing shown above is about fifty watts per square metre. Over the period in question, the temperature dropped about two and a half degrees from the peak in about 5800 BCE. That would mean the change is on the order of 0.05°C for each watt per square metre change in insolation …
…
