by J.K. Dagsvik & S.H. Moen, Nov 2023 in StatisticsNorway
Abstract
Weather and temperatures vary in ways that are difficult to explain and predict precisely. In this article we review data on temperature variations in the past as well possible reasons for thesevariations. Subsequently, we review key properties of global climate models and statistical analyses conducted by others on the ability of the global climate models to track historical temperatures.
These tests show that standard climate models are rejected by time series data on global temperatures. Finally, we update and extend previous statistical analysis of temperature data
(Dagsvik et al., 2020). Using theoretical arguments and statistical tests we find, as in Dagsvik et al.(2020), that the effect of man-made CO2 emissions does not appear to be strong enough to cause systematic changes in the temperature fluctuations during the last 200 years.
Keywords: Global climate models, Climate change, Temperature analysis, Fractional Gaussian noise,
Long-range dependence
…
by H.W. Jenkins, Nov 6, 2023 in ClimateChangeDispatch
If this column has ever plagiarized itself, it’s by repeating the phrase “evidence of warming is not evidence of what causes warming.”
A paper published by the Norwegian government’s statistical agency, written by two of its retired experts, touching on this very subject has called forth so many shrieked accusations of climate apostasy that you know it must be interesting.
The authors ask a simple question: Are computerized climate simulations a sufficient basis for attributing observed warming to human CO2? [emphasis, links added]
After all, the Earth’s climate has been subject to substantial warming and cooling trends for millenniathat remain unexplained and can’t be attributed to fossil fuels.
As statisticians, their conclusion: “With the current level of knowledge, it seems impossible to determine how much of the temperature increase is due to emissions of CO2.”
Wow. For all the abuse dumped on them for this modest observation, and even some apologetic hemming and hawing from the government-run Statistics Norway, the authors don’t say climate models don’t make useful predictions.
Their predictions are useful precisely for testing the validity of climate models. What’s more, many concerned about climate change have no trouble seeing the problem as a matter of risks rather than certainties.
This includes coauthor John Dagsvik, who told Norway’s Aftenposten newspaper he favors emissions curbs for precautionary reasons.
The correlation-to-causation puzzle is hardly the authors’ invention, having bedeviled the oracular Intergovernmental Panel on Climate Change (IPCC) since its founding in 1988.
But unrestrained name-calling is required, the critics say, because anything that undermines confidence in climate models undermines progress against climate change.
…
by A. May, Nov 14, 2021 in WUWT
In my last post I plotted the NASA CO2 and the HadCRUT5 records from 1850 to 2020 and compared them. This was in response to a plot posted on twitter by Robert Rohde implying they correlated well. The two records appear to correlate because the resulting R2 is 0.87. The least square’s function used made the global temperature anomaly a function of the logarithm to the base 2 of the CO2 concentration (or ‘log2CO2‘). This means the temperature change was assumed to be linear with the doubling of the CO2concentration, a common assumption. The least squares (or ‘LS’) methodology assumes there is no error in the measurements of the CO2 concentration and all error resulting from the correlation (the residuals) resides in the HadCRUT5 global average surface temperature estimates.
In the comments to the previous post, it became clear that some readers understood the computed R2(often called the coefficient of determination), from LS, was artificially inflated because both X (log2CO2) and Y (HadCRUT5) were autocorrelated and increased with time. But a few did not understand this vital point. As most investors, engineers, and geoscientists know, two time series that are both autocorrelated and increase with time will almost always have an inflated R2. This is one type of “spurious correlation.” In other words, the high R2 does not necessarily mean the variables are related to one another. Autocorrelation is a big deal in time series analysis and in climate science, but too frequently ignored. To judge any correlation between CO2 and HadCRUT5 we must look for autocorrelation effects. The most tool used is the Durbin-Watson statistic.
The Durbin-Watson statistic tests the null hypothesis that the residuals from a LS regression are not autocorrelated against the alternative that they are. The statistic is a number between 0 and 4, a value of 2 indicates non-autocorrelation and a value < 2 suggests positive autocorrelation and a value >2 suggests negative autocorrelation. Since the computation of R2 assumes that each observation is independent of the others, we hope that we get a value of 2, that way the R2 is valid. If the regression residuals are autocorrelated and not random—that is normally distributed about the mean—the R2 is invalid and too high. In the statistical program R, this is done—using a linear fit—with only one statement, as shown below:
…
…
by P. Gosselin, July 29, 2020 in NoTricksZone
German climatologist Professor Dr. Horst-Joachim Lüdecke recently took data from two independent studies and superimposed them. The result shows the long claimed atmospheric CO2-global temperature correlation doesn’t exist.
The first data set was global temperature anomaly going back 600 million years, taken from the results of a paper by Came and Veizer, appearing in Nature (2007) and plotted below (blue):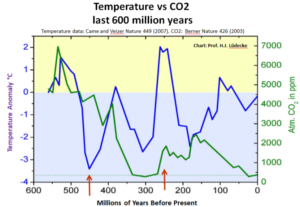
The second data set was of atmospheric CO2 going back 600 million years, taken from a published study by Berner (2003), also appearing in Nature. These data are plotted in the above chart in blue.
No correlation
The plots were combined in the above chart to see how well they correlated, if at all. The result: no correlation.
For example, as the chart shows, 150 million years ago the atmospheric CO2 concentration was over 2000 ppm, which is 5 times today’s atmospheric concentration of 410 ppm – a level that some climate scientists say is already “dangerously high”. Yet, the global temperature 150 million years ago was more than 2°C below the long-term mean.
450 million years ago the relationship was even far more on its head: atmospheric CO2 concentrations were more than 10 times today’s level, yet the global temperature was a frigid 3.5°C below the mean!
“There’s no correlation between earth temperature and CO2,” Prof. Lüdecke concludes, observing recorded data.
La géologie, une science plus que passionnante … et diverse
