by J. Lee & J. O’Neill, Nov 9, 2021 in JetPropulsionLaboratory
Earth’s atmosphere reacted in surprising ways to the lowering of emissions during the pandemic, showing how closely climate warming and air pollution are linked.
The COVID-19 pandemic and resulting limitations on travel and other economic sectors by countries around the globe drastically decreased air pollution and greenhouse gas emissions within just a few weeks. That sudden change gave scientists an unprecedented view of results that would take regulations years to achieve.
A comprehensive new survey of the effects of the pandemic on the atmosphere, using satellite data from NASA and other international space agencies, reveals some unexpected findings. The study also offers insights into addressing the dual threats of climate warming and air pollution. “We’re past the point where we can think of these as two separate problems,” said Joshua Laughner, lead author of the new study and a postdoctoral fellow at Caltech in Pasadena, California. “To understand what is driving changes to the atmosphere, we must consider how air quality and climate influence each other.”
Published Nov. 9 in the Proceedings of the National Academy of Sciences, the paper grew from a workshop sponsored by Caltech’s W.M. Keck Institute for Space Studies, led by scientists at that institution and at the Jet Propulsion Laboratory in Southern California, which is managed by Caltech. Participants from about 20 U.S. and international universities, federal and state agencies, and laboratories pinpointed four atmospheric components for in-depth study: the two most important greenhouse gases, carbon dioxide and methane; and two air pollutants, nitrogen oxides and microscopic nitrate particles.
Carbon Dioxide
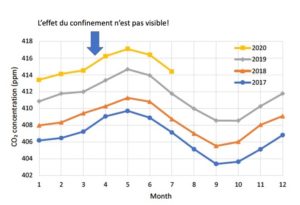
The most surprising result, the authors noted, is that while carbon dioxide (CO2) emissions fell by 5.4% in 2020, the amount of CO2 in the atmosphere continued to grow at about the same rate as in preceding years. “During previous socioeconomic disruptions, like the 1973 oil shortage, you could immediately see a change in the growth rate of CO2,” said David Schimel, head of JPL’s carbon group and a co-author of the study. “We all expected to see it this time, too.”
Using data from NASA’s Orbiting Carbon Observatory-2 satellite launched in 2014 and the NASA Goddard Earth Observing System atmospheric model, the researchers identified several reasons for this result. First, while the 5.4% drop in emissions was significant, the growth in atmospheric concentrations was within the normal range of year-to-year variation caused by natural processes. Also, the ocean didn’t absorb as much CO2 from the atmosphere as it has in recent years – probably in an unexpectedly rapid response to the reduced pressure of CO2 in the air at the ocean’s surface.
…
…

