by A. May, Dec 17, 2024 in WUWT
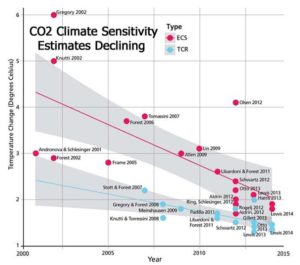
The IPCC and the climate “consensus” believe that essentially all warming since 1750 is due to man’s emissions of CO2 and other greenhouse gases as shown in figure 1 here or in (IPCC, 2021, p. 961). This has led to a 45-year search for the value of the Equilibrium Climate Sensitivity to the doubling of CO2 (“ECS” in °C per 2xCO2). Yet, after spending 45 years trying to calculate the sensitivity of climate to man-made greenhouse gases, the “consensus” has been unable to narrow the uncertainty in their estimates and, if anything, the climate model uncertainty is now larger than in earlier reports(IPCC, 2021, p. 927). It is now clear, at least to me, that modern climate models make many critical assumptions that are poorly supported and sometimes conflict with observations. This is an attempt to explain some of these problems and how they developed over time. It is long past time for the “consensus” to stop ignoring the obvious weaknesses in their 60-year old conceptual model of climate.
The Early Models
Syukuro Manabe built the first general circulation climate model with several colleagues in the 1960s (Manabe & Bryan, 1969) and (Manabe & Wetherald, 1967). He started with a one-dimensional radiative equilibrium model of horizontally averaged temperature but realized that the troposphere was not in radiative equilibrium because of convection. The lower atmosphere is nearly opaque to most surface emitted infrared radiation or Outgoing Longwave Radiation (OLR) because of greenhouse gases. As a result, Earth’s surface is not cooled much by emitting radiation but instead mostly by the evaporation of surface water that carries surface heat into the atmosphere as latent heat inside water vapor. Water vapor is less dense than dry air, so it rises. Once the water vapor is high enough, it cools as the surrounding air pressure drops allowing air parcels to expand, causing the water vapor to condense which releases its latent heat. If this is done at a high enough altitude, some of the latent heat can make it to space as radiation or make it to surrounding greenhouse gas molecules higher in the atmosphere. The rest of the released heat simply warms the neighborhood. This process is called the “moist adiabat.”
…