by J.C. Maurin, 19 juillet 2019 in ScienceClimatEnergie
Effet Bombe et Modèles du GIEC
Les prévisions du climat sont générées par des modèles informatiques. Leurs concepteurs pensent pouvoir décrire l’état moyen de l’atmosphère en 2100, en prenant comme principale donnée d’entrée, le taux futur de CO2 qui constituerait donc le ‘bouton de commande’ du climat.
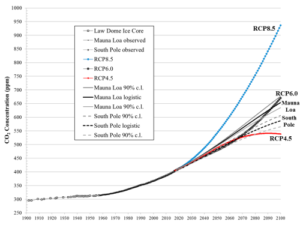
Il y a deux étages de modélisation : on commence par prévoir le taux de CO2 en 2100 avec des modèles sélectionnés par le GIEC (ces modèles « IRF » du GIEC sont l’objet de l’article).
Cette prévision constitue ensuite l’entrée du second étage, à savoir les modèles types « échanges radiatifs » ou « effet de serre » qui ne sont pas traités ici (mais on peut consulter ceci).
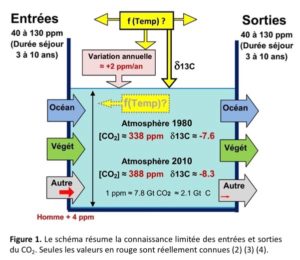
Le présent article ( qui est la suite de deux autres ici et ici) compare la réponse impulsionnelle théorique de ces modèles « IRF » avec la réponse impulsionnelle observée du 14CO2(effet Bombe).
…