by Kip Hansen, September 25, 2018 in WUWT
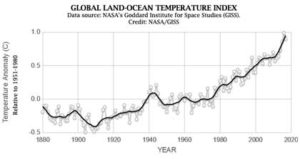
It seems that every time we turn around, we are presented with a new Science Fact that such-and-so metric — Sea Level Rise, Global Average Surface Temperature, Ocean Heat Content, Polar Bear populations, Puffin populations — has changed dramatically — “It’s unprecedented!” — and these statements are often backed by a graph illustrating the sharp rise (or, in other cases, sharp fall) as the anomaly of the metric from some baseline. In most cases, the anomaly is actually very small and the change is magnified by cranking up the y-axis to make this very small change appear to be a steep rise (or fall).
…