Archives par mot-clé : Urbanization Effect

Hot Summer In The City Or Global Boiling? Three New Studies Refute UN Hysteria

by M. Adams, Nov 1, 2023 in ClimateChangeDispatch


Nobody can rightfully claim that summer 2023 did not generate its share of fantasy-laced headlines. In this regard, the United Nations remains the world champ of propaganda by cranking out headlines including the phrase “the era of global boiling has arrived.”

The ink barely dried when it was followed by another work of climate sensationalism, this time with a headline claiming “Humanity has opened the gates to hell.” [emphasis, links added]

Amidst the swirling vortex of lies, there’s new information from the CO2 Coalition.

How many people are aware that, according to the EPA’s data from 1948 to 2020, a total of 863 weather monitoring stations—that is, 81% of them—have reported that the number of hot days has either decreased or remained unchanged?

For those of you who prefer visuals over words, there is a brilliant map [shown below and at the link above] showing that, contrary to the UN’s hysteria, in the United States, at least, we are not facing an era of global boiling, nor are we looking into the gates of hell.

….

New paper submission: Urban heat island effects in U.S. summer temperatures, 1880-2015

by Dr. Roy Spencer, Oct 21, 2023 in WUWT


fter years of dabbling in this issue, John Christy and I have finally submitted a paper to Journal of Applied Meteorology and Climatology entitled, “Urban Heat Island Effects in U.S. Summer Surface Temperature Data, 1880-2015“.

I feel pretty good about what we’ve done using the GHCN data. We demonstrate that, not only do the homogenized (“adjusted”) dataset not correct for the effect of the urban heat island (UHI) on temperature trends, the adjusted data appear to have even stronger UHI signatures than in the raw (unadjusted) data. This is true of both trends at stations (where there are nearby rural and non-rural stations… you can’t blindly average all of the stations in the U.S.), and it’s true of the spatial differences between closely-space stations in the same months and years.

The bottom line is that an estimated 22% of the U.S. warming trend, 1895 to 2023, is due to localized UHI effects.

And the effect is much larger in urban locations. Out of 4 categories of urbanization based upon population density (0.1 to 10, 10-100, 100-1,000, and >1,000 persons per sq. km), the top 2 categories show the UHI temperature trend to be 57% of the reported homogenized GHCN temperature trend. So, as one might expect, a large part of urban (and even suburban) warming since 1895 is due to UHI effects. This impacts how we should be discussing recent “record hot” temperatures at cities. Some of those would likely not be records if UHI effects were taken into account.

Yet, those are the temperatures a majority of the population experiences. My point is, such increasing warmth cannot be wholly blamed on climate change.

One of the things I struggled with was how to deal with stations having sporadic records. I’ve always wondered if one could use year-over-year changes instead of the usual annual-cycle-an-anomaly calculations, and it turns out you can, and with extremely high accuracy. (John Christy says he did it many years ago for a sparse African temperature dataset). This greatly simplifies data processing, and you can use all stations that have at least 2 years of data.

Now to see if the peer review process deep-sixes the paper. I’m optimistic.

New Study: 96% Of U.S. Climate Data Is Corrupted

by Heartland Institute, July 28, 2022  in ClimaterChangeDispatch


A new study, Corrupted Climate Stations: The Official U.S. Surface Temperature Record Remains Fatally Flawed, finds approximately 96 percent of U.S. temperature stations used to measure climate change fail to meet what the National Oceanic and Atmospheric Administration (NOAA) considers to be “acceptable” and uncorrupted placement by its own published standards. [bold, links added]

The report, published by The Heartland Institute, was compiled via satellite and in-person survey visits to NOAA weather stations that contribute to the “official” land temperature data in the United States.

The research shows that 96% of these stations are corrupted by localized effects of urbanization – producing heat bias because of their close proximity to asphalt, machinery, and other heat-producing, heat-trapping, or heat-accentuating objects.

Placing temperature stations in such locations violates NOAA’s own published standards (see section 3.1 at this link) and strongly undermines the legitimacy and the magnitude of the official consensus on long-term climate warming trends in the United States.

“With a 96 percent warm bias in U.S. temperature measurements, it is impossible to use any statistical methods to derive an accurate climate trend for the U.S.,” said Heartland Institute Senior Fellow Anthony Watts, the director of the study.

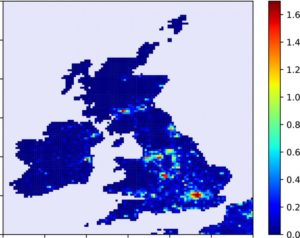
New paper: Urbanization has increased minimum temperatures 1.7K in the UK

by Ian L.M. Goddard & S. Bett, Marcy 21, 2019 in WUWT


Abstract

This study aims to estimate the affect of urbanisation on daily maximum and minimum temperatures in the United Kingdom. Urban fractions were calculated for 10 km × 10 km areas surrounding meteorological weather stations. Using robust regression a linear relationship between urban fraction and temperature difference between station measurements and ERA‐Interim reanalysis temperatures was estimated.

For an urban fraction of 1.0, the daily minimum 2‐m temperature was estimated to increase by 1.90 ± 0.88 K while the daily maximum temperature was not significantly affected by urbanisation. This result was then applied to the whole United Kingdom with a maximum T min urban heat island intensity (UHII) of about 1.7K in London and with many UK cities having T min UHIIs above one degree.

This paper finds through the method of observation minus reanalysis that urbanisation has significantly increased the daily minimum 2‐m temperature in the United Kingdom by up to 1.70 K.

Figure 5 Map showing the change in T min due to the urbanisation at the 10 km × 10 km scale over the United Kingdom and Ireland. The colour bar shows the magnitude of the temperature change in K

Japan’s JMA Claim Of “Relatively Small” Urbanization Effect Likely An Understatement Of Multiple Degrees

by Kirye and P. Gosselin, August 17, 2018 in NoTricksZone/JapanMeteorologicalAgency


Aerial photos show that the 15 temperature observation stations the JMA is using to determine mean temperature anomalies are likely impacted far more by urbanization than the agency claims.


Abashiri is in the middle of buildings and streets.

New paper shows issues with temperature records: Comparing the current and early 20th century warm periods in China

by Dr. Willie Soon et al., June 13, 2018


Recently, a new paper which we co-authored with five other researchers was published in Earth-Science Reviews entitled, “Comparing the current and early 20th century warm periods in China”. The paper is paywalled, but the journal has kindly allowed free access to the article until 20th July 2018 at this link here. If you’re reading this post after that date, you can download a pre-print here: Soon et al, 2018 ESR – China SAT trends (PDF)

The Supplementary Information and data for the paper is available here (Excel file) : Soon et al, 2018 ESR – China SAT trends – SI

The paper is quite technical and focuses specifically on Chinese temperature trends. But, we think that it will still be of interest to many readers here, especially anybody who is interested in any of the following topics:

  1. Urbanization bias

  2. The homogenization of temperature data

  3. The “early 20th century warm period” found in many parts of the Northern Hemisphere, and

  4. Comparing temperature proxies to instrumental records

China’s Urban Heat Island Problem

by Anthony Watts, April 25, 2018 in WUWT


Beijing has undergone several important urbanization development stages since late 1978. Linked with urbanization, the so-called “urban heat island effect” is a key problem caused by urban land expansion. Such changes in air temperature in Beijing inevitably have an impact on the daily lives of its inhabitants, and is therefore of considerable interest to scientists and the wider public alike.

Dr. Xiaojuan LIU and Associate Professor Guangjin TIAN from the School of Environment, Beijing Normal University, used the mesoscale Weather Research and Forecasting model coupled with a single urban canopy model and high-resolution land cover data to analyze the spatial and temporal patterns of summertime urban warming influenced by three stages of urban land expansion during 1990-2010 across Beijing. They found that urban-induced warming increased with urban land expansion, but the speed of warming declined slightly during 2000-10.

Numerical simulations to quantify the diurnal contrast in local climate trend induced by desert urbanization

by S. Kamal et al., September 30, 2017 in Environment SystemsDecisions


Within this scope, the results reveal a pattern of the climatic effect of desert urbanization with nighttime warming and weaker, but significant daytime cooling. This effect is confined to the urban area and is not sensitive to the size of the city or the detailed land cover types in the surrounding areas. The pattern is identified in both winter and summer.