
by Roy Spencer, January 15, 2020 in WUWT/Ch.Rotter
The increasing global ocean heat content (OHC) is often pointed to as the most quantitative way to monitor long-term changes in the global energy balance, which is believed to have been altered by anthropogenic greenhouse gas emissions. The challenge is that long-term temperature changes in the ocean below the top hundred meters or so become exceedingly small and difficult to measure. The newer network of Argo floats since the early 2000s has improved global coverage dramatically.
A new Cheng et al. (2020) paper describing record warm ocean temperatures in 2019 has been discussed by Willis Eschenbach who correctly reminds us that such “record setting” changes in the 0-2000 m ocean heat content (reported in Zettajoules, which is 10^^21 Joules) amount to exceedingly small temperature changes. I calculate from their data that 2019 was only
0.0040.009 deg. C warmer than 2018.Over the years I have frequently pointed out that the global energy imbalance (less than 1 W/m2) corresponding to such small rates of warming is much smaller than the accuracy with which we know the natural energy flows (1 part in 300 or so), which means Mother Nature could be responsible for the warming and we wouldn’t even know it.
The Cheng (2017) dataset of 0-2000m ocean heat content changes extends the OHC record back to 1940 (with little global coverage) and now up through 2019. The methodology of that dataset uses optimum interpolation techniques to intelligently extend the geographic coverage of limited data. I’m not going to critique that methodology here, and I agree with those who argue creating data where it does not exist is not the same as having real data. Instead I want to answer the question:
If we take the 1940-2019 global OHC data (as well as observed sea surface temperature data) at face value, and assume all of the warming trend was human-caused, what does it imply regarding equilibrium climate sensitivity (ECS)?
…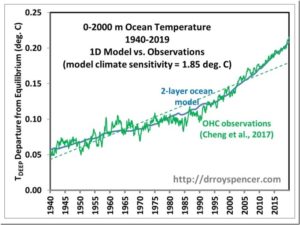
Fig. 1. Deep-ocean temperature variations 1940-2019 explained with a 2-layer energy budget model forced with RCP6 radiative forcing scenario and a model climate sensitivity of 1.85 deg. C. The model also matches the 1940-2019 and 1979-2019 observed sea surface temperature trends to about 0.01 C/decade. If ENSO effects are not included in the model, the ECS is reduced to 1.7 deg. C.
…