by P. Homewood, March 23, 2018 in NotaLotofPeopleKnowThat
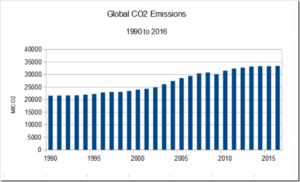
Global carbon dioxide emissions rose 1.4 percent in 2017 to a record-setting 32.5 gigatonnes, according to a report by the International Energy Agency (IEA).
Emissions rose after stalling for three years in a row, IEA reported. The Paris climate accord was signed by nearly 200 countries in 2015, which went into effect a year later. One year into the Paris accord, and emissions are on the rise.
IEA’s report echoes findings published by the Global Carbon Project late last year, predicting global emissions would rise 2 percent. The group projected emissions to rise again in 2018.
by Anthony Watts, March 23, 2018 in WUWT
From NASA Goddard:
Sea ice in the Arctic grew to its annual maximum extent last week, and joined 2015, 2016 and 2017 as the four lowest maximum extents on record, according to scientists at the NASA-supported National Snow and Ice Data Center (NSIDC) and NASA.
On March 17, the Arctic sea ice cover peaked at 5.59 million square miles (14.48 million square kilometers), making it the second lowest maximum on record, at about 23,200 square miles (60,000 square kilometers) larger than the record low maximum reached on March 7, 2017 (…)
by De Santis et al., 2017 in Int.J.RemoteSensing/in CO2Science
Over the past several years, many researchers have examined the spatial extent of sea ice around Antarctica, consistently reporting an increasing trend (see, for example, our reviews on the previously published works of Yuan and Martinson, 2000, Watkins and Simmonds, 2000, Hanna, 2001, Zwally et al., 2002, Vyas et al., 2003, Cavalieri et al., 2003, Liu et al., 2004, Parkinson, 2004, Comiso and Nishio, 2008, Cavalieri and Parkinson, 2008, Turner et al., 2009, Pezza et al., 2012, Reid et al., 2013, Reid et al., 2015, Simmonds, 2015, He et al., 2016 and Comiso et al., 2017). The latest study to confirm this ongoing expanse comes from the South American research team of De Santis et al. (2017).
by Willis Eschenbach, March 24, 2018 in WUWT
I got to thinking about the “hiatus” in warming in the 21st Century, and I realized that the CERES satellite dataset covers the period since the year 2000. So I’ve graphed up a few views of the temperature changes over the period of the CERES record, which at present is May 2000 to February 2017. No great insights, just a good overview and some interesting findings.
by Willis Eschenbach, March 24, 2018 in WUWT
Much has been made of the argument that natural forcings alone are not sufficient to explain the 20th Century temperature variations. Here’s the IPCC on the subject:
(…)
I’m sure you can see the problems with this. The computer model has been optimized to hindcast the past temperature changes using both natural and anthropogenic forcings … so of course, when you pull a random group of forcings out of the inputs, it will perform more poorly.
La géologie, une science plus que passionnante … et diverse
