UPDATE: Changed emphasis from Northern Hemisphere extratropics to entire Northern Hemisphere (h/t John Christy)
In April, 2020, the Northern Hemisphere experienced its 2nd largest 2-month drop in temperature in the 497-month satellite record.
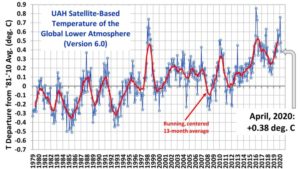
The Version 6.0 global average lower tropospheric temperature (LT) anomaly for April, 2020 was +0.38 deg. C, down from the March, 2020 value of +0.48 deg. C.
The Northern Hemisphere temperature anomaly fell from +0.96 deg. C to 0.43 deg. C from February to April, a 0.53 deg. C drop which is the 2nd largest 2-month drop in the 497-month satellite record. The largest 2-month drop was -0.69 deg. C from December 1987 to February 1988.
The linear warming trend since January, 1979 has now increased to +0.14 C/decade (but remains statistically unchanged at +0.12 C/decade over the global-averaged oceans, and +0.18 C/decade over global-averaged land).
There have been recent discussions about ‘flattening the curve’ and some curves are easier to flatten than others. The Pages 2K Consortium calculates global mean temperature in a manner that flattens the long-term trend and makes present day temperatures appear warmer relative to past temperatures. Across the globe, temperature reconstructions show cooling millennial temperature trends with one exception, the Pages 2K global mean.
Millennial Temperature Trends Show Global Cooling
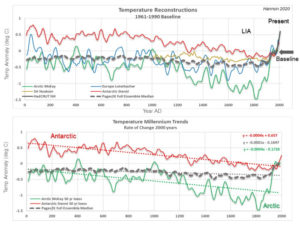
Global mean surface temperature anomalies were recently calculated by the Pages 2K Consortium led by Nuekom, 2019. Their statistical means are a conglomeration of seven different averaging methods for 7000 proxy records over the past 2000 years. The median across all global mean methods is plotted as a dashed line in Figure 1 and compared to Pages 2K’s published regional reconstructions. All means demonstrate similar trends as the median and will be simply be referred to as the global mean(s).
Regional temperature reconstructions are chosen that utilize similar proxy datasets used in the global mean calculation. The Arctic reconstruction by McKay incorporates a balance of proxy records consisting of ice cores, tree rings, lake and marine sediments north of 60 deg N. The Northern Hemisphere (NH) European reconstruction by Luterbacher is tree ring proxy based. And Stenni’s Antarctic reconstruction uses predominantly ice core isotopes.
The Pages 2K global mean appears to be reasonable compared to regional reconstructions from Present through the Little Ice Age (LIA) until about 1250 AD. Although it is difficult to see how the mean compares to regional reconstructions during the Present when using a 1961-1990 baseline as all reconstructions converge creating the “hockey stick” effect. Pre-1250 AD, the global mean appears to parallel NH Europe temperatures largely ignoring the Antarctic.
Figure 1: Top graph are surface temperature reconstructions with a 50-year loess filter plotted with Pages 2K global mean of the 7000-member ensemble across all methods. Bottom graph shows linear trends over the past 2000 years.
…
La géologie, une science plus que passionnante … et diverse