Supercomputer model simulations reveal cause of Neanderthal extinction

by Insitute for basic science, May 20, 2020 in PhsyOrg


Climate scientists from the IBS Center for Climate Physics discover that, contrary to previously held beliefs, Neanderthal extinction was neither caused by abrupt glacial climate shifts, nor by interbreeding with Homo sapiens. According to new supercomputer model simulations, only competition between Neanderthals and Homo sapiens can explain the rapid demise of Neanderthals around 43 to 38 thousand years ago.

Neanderthals lived in Eurasia for at least 300,000 years. Then, around 43 to 38 thousand years ago they quickly disappeared off the face of the earth, leaving only weak genetic traces in present-day Homo sapiens populations. It is well established that their extinction coincided with a period of rapidly fluctuating climatic conditions, as well as with the arrival of Homo sapiens in Europe. However, determining which of these factors was the dominant cause, has remained one of the biggest challenges of evolutionary anthropology.


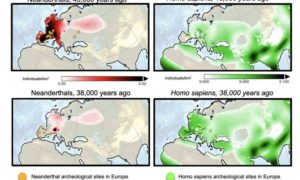
Figure 1: Computer simulations of population density of Neanderthals (left) and Homo sapiens (right)

What You Should Know About Ice Ages & Climate Change

by D.W. Euring, May 20, 2020 in PrincipiaScientificInternational


It became apparent from investigation of the Variability of the Gravitational Constant that Jupiter’s orbit is affecting the Sun’s surface temperature and driving the Sunspot Cycle which appear to be triggered at its Aphelion and suppressed at Perihelion.

Saturn has even greater eccentricity than Jupiter and it is noted that it was at Perihelion at the end of 1972 which seems to account for the Low Solar Maximum at that time and a particular dip after the main peak. So, whilst cycle periods are not influenced by Saturn, it does impact on their magnitude, and it seems likely that it will have augmented in 1957-58 as well as 1990.

Tendencies, variability and persistence of sea surface temperature anomalies

by Bulgin et al., May 14, 2020 in Nature OPEN ACCESS


Abstract

Quantifying global trends and variability in sea surface temperature (SST) is of fundamental importance to understanding changes in the Earth’s climate. One approach to observing SST is via remote sensing. Here we use a 37-year gap-filled, daily-mean analysis of satellite SSTs to quantify SST trends, variability and persistence between 1981–2018. The global mean warming trend is 0.09 K per decade globally, with 95% of local trends being between −0.1 K and + 0.35 K. Excluding perennial sea-ice regions, the mean warming trend is 0.11 K per decade. After removing the long-term trend we calculate the SST power spectra over different time periods. The maximum variance in the SST power spectra in the equatorial Pacific is 1.9 K2 on 1–5 year timescales, dominated by ENSO processes. In western boundary currents characterised by an intense mesoscale activity, SST power on sub-annual timescales dominates, with a maximum variance of 4.9 K2. Persistence timescales tend to be shorter in the summer hemisphere due to the shallower mixed layer. The median short-term persistence length is 11–14 days, found over 71–79% of the global ocean area, with seasonal variations. The mean global correlation between monthly SST anomalies with a three-month time-lag is 0.35, with statistically significant correlations over 54.0% of the global oceans, and notably in the northern and equatorial Pacific, and the sub-polar gyre south of Greenland. At six months, the mean global SST anomaly correlation falls to 0.18. The satellite data record enables the detailed characterisation of temporal changes in SST over almost four decades.

 …

WORLDWIDE VOLCANIC UPTICK — MULTIPLE ERUPTIONS TO 45,000+ FT (13.7+ KM) — DIRECT COOLING EFFECT

by Cap Allon, May 1, 2020 in Electroverse


These past few days have seen a violent worldwide volcanic uptick, sending us all further signs that the next Grand Solar Minimum is dawning.

HIMAWARI-8 (a Japanese weather satellite) recorded two HIGH-LEVEL eruptions on May 16, both occurring in Indonesia.

The first took place at Ibu –a relatively new volcano with only 3 notable eruptions; in 1911, 1998, and 2008– and was confirmed by the Volcanic Ash Advisory Center (VAAC) Darwin which warned of an ash plume rising to an estimated 45,000 ft (13.7 km).

The second high-level eruption took place just a few hours later at Semeru –a very active volcano with an eruptive history peppered with VEI 2s and 3s; the first coming in 1818, the most recent in 2014– and as with Ibu’s, Semeru’s eruption was picked up by both HIMAWARI-8 and the VAAC Darwin, with the latter confirming the generation of “a dark ash plume which reached an altitude of 46,000 ft (14 km).”

In addition, and as recently reported by VolcanoDiscovery.com, active lava flows remain active on the Semeru’s southeast flank, currently about 4,921 ft (1.5 km) long (as of the morning of May 18).

https://principia-scientific.org/do-cosmic-rays-trigger-earthquakes-volcanic-eruptions/https://www.researchgate.net/publication/234022172_Explosive_volcanic_eruptions_triggered_by_cosmic_rays_Volcano_as_a_bubble_chamber