by H. Ritchie, Sep 18, 2020, in OurWorldlinData
To prevent severe climate change we need to rapidly reduce global greenhouse gas emissions. The world emits around 50 billion tonnes of greenhouse gases each year [measured in carbon dioxide equivalents (CO2eq)].1
To figure out how we can most effectively reduce emissions and what emissions can and can’t be eliminated with current technologies, we need to first understand where our emissions come from.
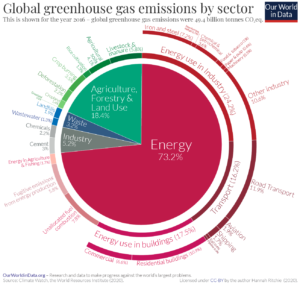
In this post I present only one chart, but it is an important one – it shows the breakdown of global greenhouse gas emissions in 2016.2 This is the latest breakdown of global emissions by sector, published by Climate Watch and the World Resources Institute.3,4
The overall picture you see from this diagram is that almost three-quarters of emissions come from energy use; almost one-fifth from agriculture and land use [this increases to one-quarter when we consider the food system as a whole – including processing, packaging, transport and retail]; and the remaining 8% from industry and waste.
To know what’s included in each sector category, I provide a short description of each. These descriptions are based on explanations provided in the IPCC’s Fifth Assessment Report AR5) and a methodology paper published by the World Resources Institute.5,6
…
by Cap Allon, Sep 20, 2020 in Electroverse
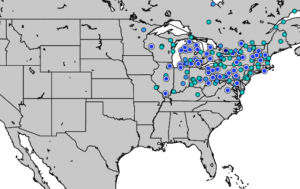
A nation-spanning mass of Arctic air has parked itself over the eastern half of North America of late, rewriting the record-books in many states, districts, and provinces, including in New York, Washington, and Ontario.
The city of Syracuse, NY tied an all-time record low of 34F (1.1C) on Saturday morning, just after 6AM, a feat originally achieved back in 1943–duringsolar minimum of cycle 17.
Buffalo also tied a low temperature record — the 38F (3.3C) registered on Saturday matched the record low for the day set back in 1995–solar minimum of cycle 22.
…
…
by P. Voosen, May 22, 2019 in AAAS/Science
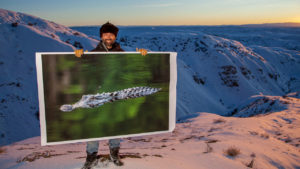
When it opens next month, the revamped fossil hall of the Smithsonian Institution’s National Museum of Natural History in Washington, D.C., will be more than a vault of dinosaur bones. It will show how Earth’s climate has shifted over the eons, driving radical changes in life, and how, in the modern age, one form of life—humans—is, in turn, transforming the climate.
To tell that story, Scott Wing and Brian Huber, a paleobotanist and paleontologist, respectively, at the museum, wanted to chart swings in Earth’s average surface temperature over the past 500 million years or so. The two researchers also thought a temperature curve could counter climate contrarians’ claim that global warming is no concern because Earth was much hotter millions of years ago. Wing and Huber wanted to show the reality of ancient temperature extremes—and how rapid shifts between them have led to mass extinctions. Abrupt climate changes, Wing says, “have catastrophic side effects that are really hard to adapt to.”
But actually making the chart was unexpectedly challenging—and triggered a major effortto reconstruct the record. Although far from complete, the research is already showing that some ancient climates were even more extreme than was thought.
…
La géologie, une science plus que passionnante … et diverse
