by A. Watts, July 1, 2021 in ClimateChangeDispatch
The headline in E&E News, WOWT-TV, Scientific American, WorldNewsNetwork, and other media outlets this week, “Unprecedented Heat Wave in Pacific Northwest Driven by Climate Change” couldn’t possibly be more unscientific.
With absolutely no analysis, no historical context, and nothing but conjecture, author Anne. C. Mulkern eschewed science for advocacy in her reporting of the brief Pacific Northwest (PNW) heatwave this week.
Yes, the heatwave set all-time high-temperature records in Washington, Oregon, and Canada. But consider this: At best, we have about 150 years of reliable weather records for the PNW, so a “black swan” outlier eventlike this isn’t surprising.
It’s happened before, most certainly. We just weren’t around to observe it. After all, Native Americans did not keep written weather records.
High- (and low-) temperature records are nothing new. But it is important to look at the past because data shows us that more high-temperature records were set during the first half of the twentieth century than during the past 50 years.
Even the Environmental Protection Agency (EPA) confirms this.
…
…
by Cap Allon, July 2, 2021 in Elecrroverse
Santa Catarina recorded snowfall in Urupema and Sao Joaquim on Wednesday — the third consecutive day of the rare phenomenon, which also included unusually chilly sub-zero temperatures.
Santa Catarina is the southernmost state of Brazil.
Temperatures across the state have plunged to a record-challenging -7.5C (18.5F), and beyond, this week, and heavy snow has been registered.
According to the Information Center of Environmental Resources and Hydrometeorology of Santa Catarina (Epagri / Ciram), this is the first year since 2000 that snow has been recorded on three consecutive days.
As reported by riotimesonline.com, plunging temperatures and favorable humidity levels have brought substantial accumulations of snow to the towns and cities located in and around the Santa Catarina Mountains
…
by J. Ambrose, One 30, 2021 in TheGuradian
Five Asian countries are jeopardising global climate ambitions by investing in 80% of the world’s planned new coal plants, according to a report.
Carbon Tracker, a financial thinktank, has found that China, India, Indonesia, Japan and Vietnam plan to build more than 600 coal power units, even though renewable energy is cheaper than most new coal plants.
The investments in one of the most environmentally damaging sources of energy could generate a total of 300 gigawatts of energy – enough to power the UK more than three times over – despite calls from climate experts at the UN for all new coal plants to be cancelled.
Catharina Hillenbrand von der Neyen, the author of the report, said: “These last bastions of coal power are swimming against the tide, when renewables offer a cheaper solution that supports global climate targets. Investors should steer clear of new coal projects, many of which are likely to generate negative returns from the outset.”
While Asia continues to plough money into coal plants, countries across the developed world are accelerating plans to phase them out. The UK government has announced plans to bring forward the deadline for coal plants to be decommissionedby one year earlier than planned, to 2024.
…
by R. Hannon, July 2, 2021 in WUWT
Introduction
This post compares CO2 ice core measurements from Greenland to those from Antarctica over the last millennium. Paleoclimate studies typically use only Antarctic ice cores to evaluate past CO2 fluctuations. This is because the entire Greenland CO2 datasets were deemed unreliable due to chemical reactions with impurities in the ice and therefore have not been used in studies since the late 1990’s. This post will demonstrate that CO2 data from Greenland ice cores have scientific value and respond to key paleoclimate events such as the Little Ice Age and Medieval Warm Period.
Antarctic Ice Core CO2 Trends
Antarctic ice CO2 data is readily available and has been studied extensively (Bauska, 2015, Ahn, 2012, Siegenthaler, 2005 and Rubino, 2019). Most of the focus of recent studies has been on high snow accumulation sites which tend to have higher resolution and less smoothing of the trapped gas age in ice bubbles due to the firn to ice transition. Gas age width and resolution ranges from 10 years in Law Dome ice cores to 65 years in Dronning Maud Land DML. Figure 1 shows CO2 data from Antarctic high-resolution ice cores over the past millennium.
Ahn et al, 2012, compiled CO2 records from the West Antarctic Ice Sheet (WAIS) and compared them to other key datasets such as Dronning Maud Land (DML), and Law Dome. Their study recognizes and discusses elevated CO2 during the Medieval Warm Period (MWP) at 1000 AD, decrease of CO2 around 1600 AD during the Little Ice Age (LIA) and the subsequent rapid increase beginning around 1850 AD.
…
…
by Roy Spencer, July 3, 2021 in WUWT
The Version 6.0 global average lower tropospheric temperature (LT) anomaly for June, 2021 was -0.01 deg. C, down from the May, 2021 value of +0.08 deg. C.
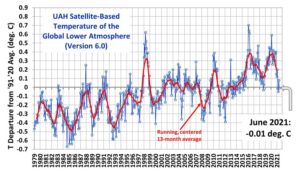
REMINDER: We have changed the 30-year averaging period from which we compute anomalies to 1991-2020, from the old period 1981-2010. This change does not affect the temperature trends.
The linear warming trend since January, 1979 remains at +0.14 C/decade (+0.12 C/decade over the global-averaged oceans, and +0.18 C/decade over global-averaged land).
…
La géologie, une science plus que passionnante … et diverse
