Permafrost developed from Termination Ia (Bölling interstadial, 14.5 cal ka BP) in Northern Iceland, in answer to deglaciation. Permafrost persisted or even re-extended during the Preboreal cooling events (at 11.2, 10.3 and 9.3 cal ka BP) synchronic with pulsated glacial advances. It disappeared below 1000 masl during the Thermal Optimum (8-5 cal ka BP). The present-day re-extent was controlled with the cooling related with the Little Ice Age and particularily the Maunder solar Minimum. Continuous permafrost is stable above 1000 masl, but is today melting between 900 and 800 masl. Discontinuous permafrost is vanishing today with the recent climate warming (from 1970), especially in palsa bogs, and on valley slopes with thermokarstic mass wasting.
The recession of the Hornbreen-Hambergbreen glaciers (Hornsund, Svalbard) will lead to the formation of a strait between the Greenland and Barents Seas within a few decades. We provide evidence for the earlier existence of this strait, in the Early–Middle Holocene and presumably since 1.3 ka cal. BP until glacier advance 0.7 ± 0.3 ka or earlier. Radiocarbon dating of mollusc shells from the ground moraines in the Hornbreen forefield indicate the existence of the marine environment at the contemporary glacierized head of Hornsund since 10.9 ka cal. BP or earlier due to glacier retreat. The gap in the radiocarbon dates between 3.9 and 1.3 ka cal. BP and the published results of 10Be exposure dating on Treskelen suggest the strait’s closure after glacier advance in the Neoglacial. Subsequent re-opening occurred around 1.3 ka cal. BP, but according to 10Be dates from Treskelen, the strait has again been closed since ca. 0.7 ± 0.3 ka or earlier. The oldest known surge of Hornbreen occurred around 1900. Analysis of Landsat satellite images, morphometric indicators characterizing the glacier frontal zones and previous studies indicate one surge of Hambergbreen (1957–1968) and five re-advances of Hornbreen in the 20th century (after 1936, between 1958 and 1962, in 1986–1990, 1998–1999, 2011). While the warmer Holocene intervals might be a benchmark for the effects of future climate change, glacier dynamics in post-Little Ice Age climate warming seems to be an analogue of glacier retreats and re-advances in the earlier periods of the Holocene.
Yes, I do know that acceleration, technically, means just a change in velocity. But, in every day English, we use acceleration to mean an increase in velocity – speeding up — and deceleration as a decrease in velocity – slowing down. I mention acceleration and deceleration because one of the major talking points of IPCC reported findings about sea level rise, the incessant media mantra, is that “Sea Level Rise is Accelerating”. (here, here, here, here, here and hundreds more here)
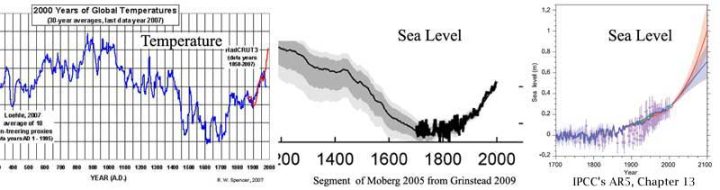
Is sea level rising? Yes, of course it is. It has been rising since about 1750-1775, coinciding with the end of the Little Ice Age. This is widely accepted as shown below:
How do we know? The important aspect of sea level is how it affects the land at the edges of the oceans. The water level there is measure by tide gauges at the ports and harbors of the world. The levels recorded by tide gauges are of local Relative Sea Level (RSL) – the level at which the sea surface hits the land. This measurement includes both the actual rise in the sea surface height (think: distance from the center of the Earth) plus any vertical movement (VLM) of the tide gauge itself, either up or down. In many locations the land mass itself is subsiding (sinking) due to glacial isostatic adjustment (GIA) as the land mass readjusts itself for the melting of the glaciers of the last great Ice Age and at most tide gauge locations, the structure to which the tide gauge tself is attached, such as a pier or dock or sea wall, is also itself subsiding due to compaction of the soil underneath and the fact that many such locations are built on man-made filled substrate. To see if sea level is rising, it is only necessary to look at high quality tide gauge records for whom the VLM is known to be relatively constant. The linearity of these graphs is typical, there are many, many more.
…
La géologie, une science plus que passionnante … et diverse