by P. Gosselin, December 11, 2019 in NoTricksZone
…
…
Not CO2 related
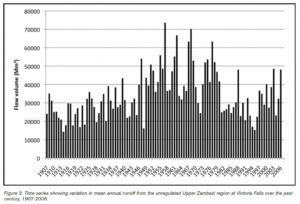
A little later in the report we also find a flow diagram for the Victoria Falls:
Figure: Water flow rate-volume at the Victoria Falls an den 1907-2006. Source: Beilfuss 2012 (immediately pdf)
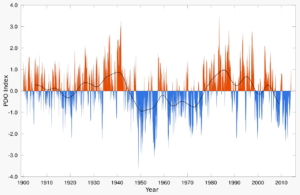
We see a strong variability from year to year. On a scale of several decades, the period 1940-1980 is characterized by particularly high flow rates. The early 20th century was rather dry. A coupling to the 60-year-old ocean cycle offers itself. The Pacific is far away, but the wet Zambezi phase fits quite well into the negative PDO:

igure: The Pacific Decadal Oscillation (PDO). Source: By Giorgiogp2 – Own work, CC BY-SA 3.0, https://commons.wikimedia.org/w/index.php?curid=13297650
…

