
by Gavin, Feb 2, 2020 in RealClimate
We have now updated the model-observations comparison page for the 2021 SAT and MSU TMT datasets. Mostly this is just ‘another dot on the graphs’ but we have made a couple of updates of note. First, we have updated the observational products to their latest versions (i.e. HadCRUT5, NOAA-STAR 4.1 etc.), though we are still using NOAA’s GlobalTemp v5 – the Interim version will be available later this year. Secondly, we have added a comparison of the observations to the new CMIP6 model ensemble.
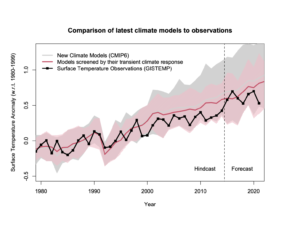
As we’ve discussed previously, the CMIP6 ensemble contains a dozen models (out of ~50) with climate sensitivities that are outside the CMIP5 range, and beyond the very likely constraints from the observations. This suggests that comparisons to the observations should be weighted in some way. One reasonable option is to follow the work of Tokarska et al (2020) and others, and restrict the comparison to those models that have a transient climate response (TCR) that is consistent with observations. The likely range of TCR is 1.4ºC to 2.2ºC according to IPCC AR6, and so we plot both the mean and 95% spread over all all models (1 ensemble member per model) (grey) and the TCR-screened subset (pink).
CMIP6 model means and spreads since 1979 (reader friendly version).
….
…