Tous les articles par Alain Préat

Full-time professor at the Free University of Brussels, Belgium apreat@gmail.com apreat@ulb.ac.be • Department of Earth Sciences and Environment Res. Grp. - Biogeochemistry & Modeling of the Earth System Sedimentology & Basin Analysis • Alumnus, Collège des Alumni, Académie Royale de Sciences, des Lettres et des Beaux Arts de Belgique (mars 2013). http://www.academieroyale.be/cgi?usr=2a8crwkksq&lg=fr&pag=858&rec=0&frm=0&par=aybabtu&id=4471&flux=8365323 • Prof. Invited, Université de Mons-Hainaut (2010-present-day) • Prof. Coordinator and invited to the Royal Academy of Sciences of Belgium (Belgian College) (2009- present day) • Prof. partim to the DEA (third cycle) led by the University of Lille (9 universities from 1999 to 2004) - Prof. partim at the University of Paris-Sud/Orsay, European-Socrates Agreement (1995-1998) • Prof. partim at the University of Louvain, Convention ULB-UCL (1993-2000) • Since 2015 : Member of Comité éditorial de la Revue Géologie de la France http://geolfrance.brgm.fr • Since 2014 : Regular author of texts for ‘la Revue Science et Pseudosciences’ http://www.pseudo-sciences.org/ • Many field works (several weeks to 2 months) (Meso- and Paleozoic carbonates, Paleo- to Neoproterozoic carbonates) in Europe, USA (Nevada), Papouasia (Holocene), North Africa (Algeria, Morrocco, Tunisia), West Africa (Gabon, DRC, Congo-Brazzaville, South Africa, Angola), Iraq... Recently : field works (3 to 5 weeks) Congo- Brazzaville 2012, 2015, 2016 (carbonate Neoproterozoic). Degree in geological sciences at the Free University of Brussels (ULB) in 1974, I went to Algeria for two years teaching mining geology at the University of Constantine. Back in Belgium I worked for two years as an expert for the EEC (European Commission), first on the prospecting of Pb and Zn in carbonate environments, then the uranium exploration in Belgium. Then Assistant at ULB, Department of Geology I got the degree of Doctor of Sciences (Geology) in 1985. My thesis, devoted to the study of the Devonian carbonate sedimentology of northern France and southern Belgium, comprised a significant portion of field work whose interpretation and synthesis conducted to the establishment of model of carbonate platforms and ramps with reefal constructions. I then worked for Petrofina SA and shared a little more than two years in Angola as Director of the Research Laboratory of this oil company. The lab included 22 people (micropaleontology, sedimentology, petrophysics). My main activity was to interpret facies reservoirs from drillings in the Cretaceous, sometimes in the Tertiary. I carried out many studies for oil companies operating in this country. I returned to the ULB in 1988 as First Assistant and was appointed Professor in 1990. I carried out various missions for mining companies in Belgium and oil companies abroad and continued research, particularly through projects of the Scientific Research National Funds (FNRS). My research still concerns sedimentology, geochemistry and diagenesis of carbonate rocks which leads me to travel many countries in Europe or outside Europe, North Africa, Papua New Guinea and the USA, to conduct field missions. Since the late 90's, I expanded my field of research in addressing the problem of mass extinctions of organisms from the Upper Devonian series across Euramerica (from North America to Poland) and I also specialized in microbiological and geochemical analyses of ancient carbonate series developing a sustained collaboration with biologists of my university. We are at the origin of a paleoecological model based on the presence of iron-bacterial microfossils, which led me to travel many countries in Europe and North Africa. This model accounts for the red pigmentation of many marble and ornamental stones used in the world. This research also has implications on the emergence of Life from the earliest stages of formation of Earth, as well as in the field of exobiology or extraterrestrial life ... More recently I invested in the study from the Precambrian series of Gabon and Congo. These works with colleagues from BRGM (Orléans) are as much about the academic side (consequences of the appearance of oxygen in the Paleoproterozoic and study of Neoproterozoic glaciations) that the potential applications in reservoir rocks and source rocks of oil (in collaboration with oil companies). Finally I recently established a close collaboration with the Royal Institute of Natural Sciences of Belgium to study the susceptibility magnetic signal from various European Paleozoic series. All these works allowed me to gain a thorough understanding of carbonate rocks (petrology, micropaleontology, geobiology, geochemistry, sequence stratigraphy, diagenesis) as well in Precambrian (2.2 Ga and 0.6 Ga), Paleozoic (from Silurian to Carboniferous) and Mesozoic (Jurassic and Cretaceous) rocks. Recently (2010) I have established a collaboration with Iraqi Kurdistan as part of a government program to boost scientific research in this country. My research led me to publish about 180 papers in international and national journals and presented more than 170 conference papers. I am a holder of eight courses at the ULB (5 mandatory and 3 optional), excursions and field stages, I taught at the third cycle in several French universities and led or co-managed a score of 20 Doctoral (PhD) and Post-doctoral theses and has been the promotor of more than 50 Masters theses.

HadCRUT Data Manipulation Makes 2000-2014 Warming Pause Vanish


by K. Richard, Jan 12, 2023 in PrincipiaScientifIntern


The Met Office and the Climate Research Unit are at it again, making adjustments to the temperature records to increase the claimed rate of warming.

From 2009 to 2019, there were 90 peer-reviewed scientific papers published on the global warming “pause” or “hiatus” observed over the first 15 years of the 21st century.

The HadCRUT3 global temperature trend was recorded as 0.03°C per decade during the global warming hiatusyears of 2000-2014 (Scafetta, 2022).

This was increased to 0.08°C per decade by version 4, as the overseers of the HadCRUT data conveniently added 0.1°C to 0.2°C to the more recent anomalies.

Today, in HadCRUT5, the 2000-2014 temperature trend has been adjusted up to 0.14°C per decade when using the computer model-infilling method.

So, within the last decade, a 15-year temperature trend has been changed from static to strong warming.

See more here notrickszone.com

It’s temperature prediction time again!

by Net Zero, Jan 13, 2023  NetZeroWatch


  1. Each year, we invite Net Zero Watch readers to enter our annual Global Temperature Prediction Competition, in which we try to outdo the Met Office for the accuracy of our soothsaying.

  2. For 2022, the Met Office predicted an average of between 0.97 and 1.21°C (midpoint 1.09°C) above pre-industrial temperatures for the HadCRUT5 index. However, Net Zero Watch readers, as is their wont, went slightly lower, with the median prediction coming in at 1.00°C, and the mode at 1.03°C. This is all shown in the graph below, alongside the correct value, just announced by the Met Office, of 1.16°C.

As you can see, none of our competition entrants got the right answer. There were three people just above, and three more just below. We’ll put all six names into a hat to pick a winner. We’ll be in contact shortly.

If you’d like to enter the 2023 competition, now is your chance!

As always, the prize is a bottle of hooch of your choice, and a book from the GWPF or Net Zero Watch publication lists.

The Met Office reckons on a relatively sharp warming, suggesting HadCRUT5 will come in at between 1.08 and 1.32°C above pre-industrial (with a central estimate of 1.20°C). That’s 0.04°C above last year’s outturn, which doesn’t seem unreasonable, assuming we come out of the La Nina conditions that prevailed in 2022.

To enter, click here (opens a new site). Good luck!

German Renewable Energies Expert : Global Warming is Going To Pause As North Atlantic Cools

by Prof. F. Vahrenholt, Jean 11, 2023 in Clintel


The unusually mild weather at the turn of the year in Central Europe has strengthened the belief of many in Germany that CO2-induced global warming is in full swing. Globally – and this is the only thing that matters – temperatures are developing in a different direction.

If we take the average of the last years, the global temperature has been constant for 8 years and 4 months.

In December, the deviation of the global temperature from the 30-year average of the satellite-based measurements of the University of Alabama (UAH) dropped again, to 0.05 degrees Celsius. To be sure, there is a long-term temperature increase through 2015. But it has averaged only 0.13 degrees Celsius per decade since 1979.

Weakening North Atlantic Oscillation

But it gets even better: the latest scientific studies show for Europe that it will first go slightly downhill for 15-20 years.

Chart by Dr. Roy Spencer.

Some climate science heavyweights recently caused a stir in the Nature journal “Climate and Atmospheric Science.” Katja Matthes, director of the GEOMAR Helmholtz Centre for Ocean Research in Kiel, Johann Jungclaus of the Max Planck Institute for Meteorology in Hamburg and Nour-Eddine Omrani of the Norwegian Bjerknes Centre for climate research published a study showing that we are facing a weakening of the North Atlantic Oscillation, a cooling of the North Atlantic and a related global temperature development as between 1950 and 1970 (the authors say in their summary).

The graph shows the decline in North Atlantic temperatures by 2040, but because of the global warming trend, temperatures are not falling back to 1950-1970 levels, explains one of the authors, Eddine Omrani. The expected pause in warming gives us time, Omrani says, to work out technical, political and economic solutions before the next warming phase, which will take over again from about 2050.

Why is the coming cooling in Europe not being reported ?

Good 2022 Climate News the MSM didn’t tell you

by J. Vinos, Jan 8, 2023 in WUWT


No minimally informed person denies that climate changes. The climate has always changed. Since 1860 the predominant climate change has been warming, which is fortunate because if we had a winter like those of 1800-1850, we would be in for a shock. No one has been able to prove that global warming is primarily a consequence of our emissions. It is reasonable to assume that increased CO2 has contributed to warming since the mid-20th century when our CO2 emissions increased significantly, but no one knows how much they have contributed, no matter how much the Intergovernmental Panel on Climate Change (IPCC) insists that “humans are the dominant cause of observed global warming over recent decades.”(IPCC AR6, page 515).

There is no evidence for this statement. I know this because I have read thousands of scientific papers looking for it. And no, computer models are not evidence of anything but the programming skills of their authors. Models and their predictions are constantly changing and when our knowledge of climate changes, they must be redone.

The absolute lack of evidence contrasts sharply with the decision to cut our CO2 emissions to zero by completely changing our fossil fuel-based energy system and calling CO2 a pollutant—when it is as essential to life as oxygen. All this while most of the world doesn’t give a damn about emissions and many are only on board for the promised money.

….

UAH Global Temperature Update: 2022 was the 7th Warmest of 44-Year Satellite Record

by R. Spencer, Jan 3, 2023 in GlobalWarming

December of 2022 finished the year with a global tropospheric temperature anomaly of +0.05 deg. C above the 1991-2020 average, which was down from the November value of +0.17 deg. C.

The average anomaly for the year was +0.174 deg. C, making 2022 the 7th warmest year of the 44+ year global satellite record, which started in late 1978. Continuing La Nina conditions in the Pacific Ocean have helped to reduce global-average temperatures for the last two years. The 10 warmest years were:

  • #1 2016 +0.389
  • #2 2020 +0.358
  • #3 1998 +0.347
  • #4 2019 +0.304
  • #5 2017 +0.267
  • #6 2010 +0.193
  • #7 2022 +0.174
  • #8 2021 +0.138
  • #9 2015 +0.138
  • #10 2018 +0.090

The linear warming trend since January, 1979 continues at +0.13 C/decade (+0.12 C/decade over the global-averaged oceans, and +0.18 C/decade over global-averaged land).

2022, Seventh Warmest Year: Warming Slows Down

by Andy May,  Jan 7, 2023 in Petrophysicist


No minimally informed person denies that climate changes. The climate has always changed. Since 1860 the predominant climate change has been warming, which is fortunate because if we had a winter like those of 1800-1850, we would be in for a shock. No one has been able to prove that global warming is primarily a consequence of our emissions. It is reasonable to assume that increased CO2 has contributed to warming since the mid-20thcentury when our CO2 emissions increased significantly, but no one knows how much they have contributed, no matter how much the Intergovernmental Panel on Climate Change (IPCC) insists that “humans are the dominant cause of observed global warming over recent decades.” (IPCC AR6, page 515).

There is no evidence for this statement. I know this because I have read thousands of scientific papers looking for it. And no, computer models are not evidence of anything but the programming skills of their authors. Models and their predictions are constantly changing and when our knowledge of climate changes, they must be redone.

The absolute lack of evidence contrasts sharply with the decision to cut our CO2 emissions to zero by completely changing our fossil fuel-based energy system and calling CO2 a pollutant—when it is as essential to life as oxygen. All this while most of the world doesn’t give a damn about emissions and many are only on board for the promised money.

To get to the good news about global warming we need to look at variations in the rate of global warming, i.e., the speed of warming. Today we are going to use satellite-calculated global temperature data from the University of Alabama in Huntsville, UAH 6.0. They are plotted in Figure 1.

Figure 1. UAH satellite global temperature anomaly data in °C relative to the mean from 1991 to 2020. In green is the linear trend of the series (+0.13 ºC/decade) and in blue is the linear trend since 2016. Data: UAH 6.0Graph: Woodfortrees.

As we can see, the temperature trend decreases since 2016, so 2022 is the seventh warmest year. For 7 years the planet has been cooling. Does that mean that warming is over? No, periods of 7 years of cooling are frequent in the record, there being 8 of them since 1979, and the warming continues. But there is only one period of more than 15 years of cooling, from 1998 to 2014, that appears in the record for the last 45 years. It is known as the “Pause.”

To analyze the evolution of the warming rate, we subtract from each monthly data the previous one to calculate the monthly increase. We then deseasonalize the monthly increase by finding the 12-month moving average to remove a lot of the noise. Finally, we calculate the 15-year average warming rate in °C/decade by calculating the 180-month moving average and multiplying the resulting data by 120.

Figure 2. Evolution of the warming rate for 15-year periods between 1979 and 2022 in °C/decade and its linear trend, from monthly UAH 6.0 satellite temperature data.


New Study: A ‘Thought Model’ Saying There’s A 33 K ‘Natural Greenhouse Effect’ Is ‘Meritless’ Assumption

by K. Richard, Dec 26, 2022 in NoTricksZone


The conceptualization of a 33 K warmer Earth due to the presence of water vapor and CO2 (greenhouse gases) in the atmosphere is wholly based on the unobserved and unknown, or assumptions about what an imaginary world with no atmosphere would be like.

It is widely believed that we can determine the effective radiating temperature, a uniformly global temperature, the globally uniform albedo…of a rocky planets simply by conjuring up thought experiments about what a made-up world would be like if it did not have an atmosphere (e.g., no N2, O2, atmospheric pressure, clouds, water vapor…).

This “thought model” has been subjected to critical analysis in a new paperpublished by four atmospheric physicists.


Image Source: Kramm et al., 2022

The authors use observational measurements from 24 datasets for the moon — which actually is the closest real-world proximity to a rocky planet without an atmosphere — as their testbed. They conclude that the globally averaged surface temperature is necessarily “about 60 K” lower than the effective radiation temperature, rendering the “thought model” presumptions about a 33 K “greenhouse effect” differential for the effective radiating vs. global average temperature (255 vs. 288 K) “meritless.”

Other instances of a disqualifying contrast between observations and modeled assumptions include:

What If Real-World Physics Do Not Support The Claim Top-Of-Atmosphere CO2 Forcing Exists?

by K. Richard, Dec 22, 2022 in NoTricksZone


 Schneider et al., 2020, NASA, UCAR, CGA

TOA greenhouse gas forcing is a fundamental tenet of the CO2-drives-climate-change belief system. And yet the “global-mean longwave radiative forcing of CO2 at TOA” (Schneider et al., 2020) may not even exist.

It is easily recognized that water vapor (greenhouse gas) forcing cannot occur above a certain temperature threshold because water freezes out the farther away from the surface’s warmth H2O goes.

According to NASA, the TOA is recognized as approximately 100 km above the surface. The temperature near that atmospheric height is about -90°C.

CO2 is in its solid (dry ice) form at -78°C and below.

Therefore, TOA CO2 radiative forcing cannot exist if CO2 cannot be a greenhouse gas at the TOA.

UAH – What is Foretold

by D. Archibald, Dec 22, 2022 in WUWT


We all know that Santa’s workshop is somewhere in the Arctic, producing toys for the world’s children. Also north of the Arctic Circle is Professor Humlum’s office at the Unversity of Svalbaard wherein he toils each month to update a report on climate. The first chart in that report is the UAH temperature for the lower troposphere, copied following and annotated with lines showing the evident trends:

Figure 1: UAH global temperature anomaly

In the period from 1978 to 2015, the lower bound of the record is shown by the orange line. Then there was a period of a couple of years in which the temperature anomaly was in a narrow, steep uptrend channel. The temperature anomaly broke up from that channel due to the 2016 El Nino.

Since that 2016 El Nino, two parallel upper bounding lines have formed, in downtrend. The lower green one is formed by six points. The upper red line is formed from only two points – the minimum to make a line – but is notable in that it is parallel to the green line. So climate isn’t a randowm walk. There is some physical process that limits how far temperature excursions go.

The uptrend from the beginning of the satellite record in 1978 to 2015 was 0.4°C over 36 years. That equates to 0.000926°C per month. If we take that amount from each monthly temperature anomaly, cumulatively, we produce the following graph of the detrended monthly temperature anomaly distribution from 1978 to 2015:

Arctic Report: primary productivity still high & sea ice flatline continues despite warmer temperatures

by Polar Bear Science, Dec 14, 2022

NOAAs annual Arctic Report Card is, for the most part, a valiant effort to turn good and ambiguous news into harbingers of climate change disaster. Primary productivity is up across most of the region (good news for wildlife) and despite Arctic temperatures being “twice as high” as the rest of the world in recent years, the summer sea ice ‘death spiral’ has failed to materialize.

Oddly, there is no bad news about polar bears (last mention was 2014). However, the media were told that the few hundred sea birds that died this year in the enormous Bering/Chukchi Sea region over the four months of summer in 2022 is a portend of climate change catastrophe–even though the authors of the NOAA report admit they have no conclusive evidence to explain the phenomenon. However, here are also some honest figures that are quite illuminating.

Sea ice

The graph at the bottom of this graphic, spread out rather than bunched up to make changes seem more dramatic, makes it much easier to see the lack of a declining trend in sea ice extent since 2007, and that winter (March) coverage has changed hardly at all.

Claim: Computer Models Predict a Third of Vertebrates will Die by 2100

by E. Worrall, Dec 17, 2022 in WUWT


My question – which part of this real world story of ecological disaster and recovery shouts fragile food web?

In my opinion the European supercomputer food web experiment is way too unrealistic to draw real world conclusions. New connections in the real world food web appear all the time, no food resource remains underutilised for long, even when the underutilised resource is a deadly toxic toad. Any breaks in the food web caused by climate change or disease or whatever, in the real world are rapidly filled.

There are a handful of species which are so specialised they actually would die if their food source was removed. For example, Koala Bears are so specialised at eating Eucalyptus leaves, they would likely all die if say a Eucalypt version of Dutch Elm Disease killed off all the Eucalyptus trees.

But are 17.6% of vertebrate species so specialised they cannot adapt to a small change in temperature? Are 27% of vertebrates about to die out? That seems highly implausible.

A few degrees of warming, if it occurs, is not an asteroid scale ecological catastrophe, or a million year duration volcanic eruption, it is a mild shift in climatic conditions, which life will have no problem adapting to if the paleo record is any guide. Just like life has already adapted to the many climatic shifts, introduced species and other disruptions which have occurred in Earth’s geological past.

New Study: Greenhouse Gases May Not Be Causing 21st-Century Warming

by D. Whitehouse, Dec 16, 2022 in ClimateChangeDispatch


A new study by a team of leading climate scientists suggests that the effect of carbon dioxide this century might be small if not undetectable when compared to natural climate variability.

Global surface temperature is and always has been the key climate parameter. Whatever is happening to the Earth’s climate balance, it must, sooner or later, be reflected in the global annual average temperature, and not just in regional variations. [emphasis, links added]

But therein lies what is to some an inconvenience as the changes in the global temperature this century are open to differing interpretations including the suggestion that increases in anthropogenic greenhouse gas emissions are not needed to explain the changes we have seen in the last 20 years or so.

It’s a conclusion that many would dismiss as coming from climate “skeptics,” or downright deniers.

But what if it’s the view of scientists from two of the world’s leading institutes researching climate change; the University of Oxford and the US National Center for Atmospheric Research? Then it must be taken seriously and not dismissed offhand.

It is important research because it is the trend in the increase of global temperature caused by anthropogenic [human-caused] greenhouse gas emissions that is the most important variable for policymakers considering the scale and timescale of action in the coming decades.

However, this vital parameter is uncertain because recent decades have shown that we are living through a period of considerable natural climate variability.

Thus, a new study published in the Journal of Climate suggests the effect of carbon dioxide this century might be small if not undetectable when compared to natural climate variability.

The researchers contend that recent temperature trends might indicate that there is no detectable increase in global temperature due to greenhouse gas emissions.

While this suggestion is interesting it must be said that the researchers get themselves in a muddle when estimating temperature trends this century.

On the one hand, they acknowledge the existence of the global temperature hiatus between 2000 – 2014, but on the other hand, they do not properly distinguish the effects of the natural El Nino eventsthat have taken place in the past seven years.

This is why they conclude there might have been an acceleration in global temperature increase over this period.

They say that most of the increase is not due to greenhouse gases but to aerosol emission reductions.

The combustion of fossil fuels releases greenhouse gases but it also causes pollution that cools the Earth,offsetting any warming.

This is good news for public health as airborne particles kill several million people a year, but it also accelerates global warming.

They assess that aerosol emissions have contributed to an increase in the rate of anthropogenic warming since 2000 although they have large uncertainty.

When considering estimates of the amount of warming due to aerosol reduction along with natural climate variability, they find a solution with all the post-2000 temperature trends being due to natural variability alone.

They say (p 4283) it’s a credible hypothesis that global temperature changes since 2000 could be “arising largely from internal variability.”

Read more at NZW

Also here

IPSOS Global Poll: 4 In 10 People Believe Climate Change Is Natural

by P.J. Watson, Dec 13, 2022 in ClimateChangeDispatch


The results of a global poll are sure to shock those who claim that the “science is settled” on climate change – nearly four out of ten people believe it is natural, not man-made.

The worldwide IPSOS survey asked people in 30 countries across five continents to give their views on what they thought was causing climate change. [emphasis, links added]

Thirty-seven percent of respondents said they believed it was “mainly due to the kinds of natural phenomena that the Earth has experienced throughout its history.

In the seven countries where political leanings were recorded, 28 percent of leftists said they were climate skeptics, while 50 percent of right-leaning respondents said they were doubtful.

According to energy company EDF, which commissioned IPSOS to conduct the poll, the results were “unexpected.”

“The degree of skepticism over human-caused global warming will shock the ‘settled’ science green catastrophists, who use constant scare tactics to promote the command-and-control Net Zero agenda,” writesChris Morrison.

Despite EDF asserting that populations are starting to notice the supposed increase of “extreme climate events,” regardless of doubts as to whether this is even happening, the energy company noted that it is not making them “more concerned, nor is it convincing them of the human origins of the phenomenon.

In other words, despite decades of being constantly bombarded with “the message” that humans are solely responsible for climate change, a huge chunk of the global population still isn’t buying it.

EDF notes that climate skepticism has grown by six points over the last three years, while skepticism in France grew by eight points in a single year.

The reality of what ‘net zero’ actually means for people’s standard of living and their finances appear to be hitting home amidst a cost of living crisis that has led many in the West to be unable to afford their heating bills.

No doubt calls for wealthier Western countries to pay “climate reparations” is also causing more people to question precisely where their money is going and for what purpose.

Meanwhile, despite Just Stop Oil climate change protesters staging unruly demonstrations for months in London, the sudden cold snap appears to have made them all disappear.

Despite Alarmist Reports, Drought In The Horn Of Africa Not From Climate Change

by L. Lueken, Dec 13, 2022 in ClimateChangeDispatch


A recent article in Inside Climate News by writer Georgina Gustin leverages a tragic period of severe drought in the Horn of Africa in order to push an alarmist narrative on climate change.

Gustin claims that food security is threatened by climate change and that millions will starve as a result of it. This is false.

Data show that food security has improved over the past decades of warming. [emphasis, links added]

If there is to be a global food crisis, it won’t be climate change that causes it, but rather the heavy-handed and ultimately futile efforts at controlling the weather by regulating how people grow crops and livestock.

The piece, titled “Climate Change is Driving Millions to the Precipice of a ‘Raging Food Catastrophe’,” focuses primarily on the specific example of the severe ongoing drought in Kenya and neighboring Somalia and Ethiopia.

Mountain glacier melting is linked to shifting westerlies and likely to accelerate

by University of Maine, Dec 13, 2022 in ScienceDaily 


The combination of global atmospheric warming and westerly winds shifting toward the poles will likely speed up the recession of mountain glaciers in both hemispheres, according to a UMaine study.

Mountain glaciers freeze and gain mass when the climate cools, and melt and lose mass when the climate warms. The extent to which the fluctuations in mountain glaciers are reflective of local, regional and even hemispheric climate variations, however, is less clear, which has made it more difficult for scientists to use glacial data to interpret past climate dynamics and make predictions for the future.

A team of researchers from the University of Maine conducted a National Science Foundation-funded study evaluating how atmospheric conditions are reflected in the mass fluctuations of mid-latitude glaciers on opposite sides of the Earth, comparing global temperature and wind changes with glacier snowline elevations (also called “equilibrium-line altitudes”) in the Southern Alps of New Zealand and in the European Alps observed over the course of nearly four decades. Glacier extent is dependent on the height of the snowline in the atmosphere, below which ice melts, which in turn is determined by the temperature of the atmosphere.

The data showed that the fluctuations in glacial snowlines reflected temperature changes over large regions of the atmosphere for the two mountain systems studied — even on hemispheric scales. Moreover, the latitudes of westerly wind belts were found to be important for regulating the proportion of cold versus warm air masses that influence glacier melting and freezing.

Ipsos: Climate Skepticism Rising Three Years in a Row

by E. Worrall, Dec 10, 2022 in WUWT


“… Unexpectedly, climate skepticism has consistently grown over the past 3 years (37%, +6 pts in 3 years), and is particularly striking in France this year (37%, +8 pts in one year) …”

Climate change: a growing skepticism 

ENERGY & ENVIRONMENT

Purchasing power is now the key priority on a global level. Despite the importance they attribute to the climate and extreme weather events, people are less inclined to become involved and are more dubious as to the human origins of the phenomenon.

8 December 2022

Despite topping the list of environmental priorities, climate change is not generating greater concern and climate skepticism is growing

Climate change (46%, +2 points vs. 2021) and extreme climate events (43%, +2 points vs. 2021) have become the key reasons for environmental concern this year on a world level, although this is also due to the drop in concern about waste and plastic (41%, -5 points vs 2021) and air pollution (37%, -3 points vs 2021). Nevertheless, if the two items are combined, 66% of the world’s population still view the climate as a priority issue (60% in 2019).

In France 16-24-year-olds are less worried than the population as a whole (45%), but they are either more indifferent (16% vs 7% overall), or on the contrary express greater demoralization (38% vs 27% overall).

Unexpectedly, climate skepticism has consistently grown over the past 3 years (37%, +6 pts in 3 years), and is particularly striking in France this year (37%, +8 pts in one year)2 whereas concern about the environment is particularly strong in that country. More specifically, the idea that has progressed the most is not a denial of change, but the notion that it is “mainly due to the kinds of natural phenomena that the Earth has experienced throughout its history”. …

Age does not appear to be a divisive criterion on this subject: …

Read more: https://www.ipsos.com/en/obscop-2022

On one hand I’m encouraged that young people seem to be starting to break free from all the intense green brainwashing many of them experienced at school.

Having said that, the proportion of people who hold hardline alarmist views also seems to have edged up slightly – so a component of that increase in skepticism may represent an increase in polarisation.

I wish there was a way to somehow increase the rate of progress. It is sad watching people in Britain, Europe and parts of the USA suffering unnecessary hardship because political climate activism has driven up the price of energy, even if many of those people voted for the politicians who created this mess. I guess sometimes people have to learn the hard way.

g

Electric Cars Are Futile As A Solution To The So-Called ‘Climate Crisis’

by A. Watts, Dec 9, 2022 in ClimateChangeDispatch


The Department of Energy’s Argonne National Laboratory recently released a study titled, “Assessment of Light-Duty Plug-in Electric Vehicles in the United States, 2010 – 2021,” which shows that in 2021, privately-owned plug-in hybrid electric vehicles (PHEVs) and electric vehicles (EVs) “saved about 690 million gallons of gasoline.”

However, that is a huge exaggeration because fossil fuels provide 61 percent of the electricity in the United States. [emphasis, links added]

This means we have to include the inefficiency of burning coal or natural gas to make electricity(around 45 percent), transmission losses (about 5 percent), and losses in the inverter to charge the battery(another 5 percent).

Considering those losses, less than 33 percent of that apparent savings is a real reduction in fossil fuel use, the equivalent of roughly 230 million gallons of gasoline.

The Argonne study also says that from 2010 to 2021, EVs saved 2.1 billion gallons of gas. So, using the guideline of 61 percent from above, let’s be generous and say that over 11 years, EVs have saved about a third of that, the equivalent of about 750 million gallons of gasoline.

Although 750 million gallons of gasoline sounds like a huge amount, when you put into perspective the larger picture of gasoline use, that savings is actually a drop in the bucket.

According to the U.S. Energy Information Administration (EIA), “In 2021, about 134.83 billion gallons (or about 3.21 billion barrels) of finished motor gasoline were consumed in the United States, an average of about 369 million gallons per day (or about 8.80 million barrels per day).”

Using simple arithmetic, dividing those 750 million gallons of gasoline saved from 2010 to 2021 according to the Argonne Lab study, by the daily U.S. consumption of gasoline, we get 750/369 = 2.03 days.

New Study: Observational Data Affirm 95% Of Post-1970s Warming Is Not Linked To CO2 Increases

by K. Richard, Dec 8, 2022 in NoTricksZone


Of the warming trends in Poland and greater Europe, “only about 4–5% are explained by an increase in CO2 concentration.”  –  Marsz et al., 2022 

Internal changes to the thermal structure of the ocean transmit decadal-scale changes in the atmospheric circulation and consequent surface air temperature via its modulating impact on the variation in the amount and intensity of solar radiation (sunshine duration, or SD) reaching the Earth’s surface.

This is not only observed for Poland and/or Europe as detailed in a new study, but the causal structuring of cloud cover changes driving the variations in solar radiation reaching the surface and modulating climate can be applied throughout the globe ( Wang et al., 2002, Wielicki et al., 2002Loeb et al., 2021, Herman et al., 2013Poprovsky, 2019, Dübal and Vahrenholt, 2021, Swift, 2018, Stephens et al., 2022).

Therefore, “the main cause of the change in the state of the climate may be the action of the internal variability of the ocean–atmosphere system” (Marsz et al., 2022).

MIT Climate Scientist Dr. Richard Lindzen Rejects ‘Climate Change’ As ‘A Quasi-Religious Movement Predicated on An Absurd ‘Scientific’ Narrative’

by R. Lindzen, Dec 5, 2022 in WUWT


Dr. Richard Lindzen’s new paper: An Assessment of the Conventional Global Warming Narrative – Published by the Global Warming Policy Foundation – September 22, 2022: Climate change is “a quasi-religious movement predicated on an absurd ‘scientific’ narrative. The policies invoked on behalf of this movement have led to the US hobbling its energy system.” – “The Earth’s climate has, indeed, undergone major variations, but these offer no evidence of a causal role for CO₂.”

“Unless we wake up to the absurdity of the motivating narrative, this is likely only to be the beginning of the disasters that will follow from the current irrational demonization of CO₂.”

By: Admin – Climate Depot

Click to access 2022-09-22-Lindzen-global-warming-narrative.pdf


CO₂ is a particularly ridiculous choice for a ‘pollutant.’ Its primary role is as a fertiliser for plant life. Currently, almost all plants are starved of CO₂. Moreover, if we were to remove a bit more than 60% of current CO₂, the consequences would be dire: namely death by starvation for all animal life. It would not likely lead to a particularly cold world since such a reduction would only amount to a couple of percent change in the radiative budget. After all, a 30% reduction of solar radiation about 2.5 billion years ago did not lead to an Earth much colder than it is today, as we earlier noted in connection with the Early Faint Sun Paradox.

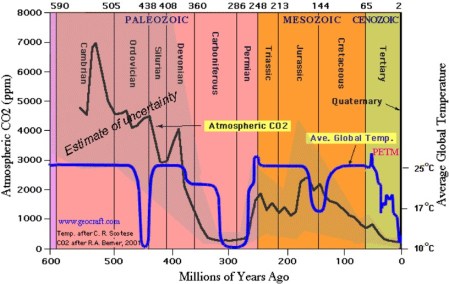
The Earth’s climate has, indeed, undergone major variations, but these offer no evidence of a causal role for CO₂. For the glaciation cycles of the past 700 thousand years, the proxy data from the Vostok ice cores shows that cooling precedes decreases in CO₂ despite the very coarse temporal resolution (Jouzel et al.,1987, Gore, 2006). Higher temporal resolution is needed to show that warming preceded the increase in CO₂ as well (Caillon et al, 2003). For earlier variations, there is no suggestion of any correlation with carbon dioxide at all, as shown in Figure 9a, a commonly presented reconstruction of CO₂ levels and ‘temperature’ for the past 600 million years or so.

Oimjakon, Siberia Sees “Extremely Low Temperatures” As Mercury Plummets To 65 Below!

by P. Gosselin, Dec4, 2022 in NoTricksZone


Unusual temperatures for early December…knocking at energy-deprived Europe’s door 

German meteorologist Dominik Jung of wetter.net says, after having reported yesterday of -50°C in Oimjakon, Siberia: “-54°C were measured there this morning.”

-54°C is 65 below Fahrenheit.

“For early December, these are extremely low temperatures there, which are normally expected only at the end of December or beginning of January,” says Jung.


Moreover, Jung reports that all weather models are on an early winter course for Europe and that there is more winter than in the December months of the past 12 years.

“For the 3rd Advent, fresh snow is expected down to low altitudes. Winterly it goes on.”

There’s a real threat the extreme cold may spill over Europe, which is energy deprived. This could spell disaster. Let’s hope the model forecasts for more cold, like today’s GEM output of -16°C for Düsseldorf on December 14th, don’t turn into reality.

Chicken Little Propaganda Dressed Up As Science

by P.  Ridd, Nov 26, 2022 in InstitueofPublicAffairs


ORIGINALLY APPEARED IN THE AUSTRALIAN

The Bureau of Meteorology and the CSIRO have delivered their ­biennial dose of depression about the climate, but their report ignores a slew of positive environmental changes.

The Bureau of Meteorology and the CSIRO have delivered their ­biennial dose of depression about the climate in their latest State of the Climate report. The climate has warmed by 1.5C and there is barely a single benefit – it is all ­disaster.

It is often said, “if it is too good to be true, it probably is” and you are being conned. What about too bad to be true? Can a gently warming climate have no significant benefits at all? The only marginally encouraging part of the report is about northern Australia. There might have been a slight reduction in cyclone numbers, and there has been a bit more rain in the recent decades.

Apart from that, the report reads like the Book of Exodus – one disaster after another. Only the frogs and boils are missing.

But it is significant that the period when Egyptians were building pyramids, which was hotter than today’s climate, is often called the Holocene Climatic Optimum. The word “optimum” was an indication that scientists working in the era before climate alarmism could see some advantage of a warmer climate.

A sure sign that the report tries too hard to find disaster is when it discusses coral bleaching and the Great Barrier Reef. It stresses that there have been four bleaching events in the past six years, which it implies were devastating. But for some reason the report fails to mention that this year the reef recorded its highest amount of coral since records began in 1985.

This proves that all the hype about the coral loss from bleaching was greatly exaggerated. But the report writers were obviously ­untroubled by the contradictory evidence. They ignored it.

Keeling Curve CO2 Measurements Halted By Mauna Loa Eruption

by BigIslandVideoNews, Nov 29, 2022


(BIVN) – The collection of data for use in the decades-long record of atmospheric carbon dioxide, known famously as the Keeling Curve, was cut off on Monday night, as lava from the latest Mauna Loa eruption flows down the mountain.

The lava crossed the Mauna Loa Weather Observatory Road at approximately 8 p.m. in the evening, cutting off power to observatory facilities and equipment.

Researchers at Scripps Institution of Oceanography at UC San Diego, which started collecting the Keeling Curve data at the site in 1958, say they “are exploring options regarding the relocation of measurement equipment.” From the Tuesday announcement:


..


See also Mauna Loa eruption cuts access, power to Mauna Loa Observatory

The Great Famine of the 21st Century

by D. Siegel,  Nov 29, 202 in Shortfall


The true tragedy

The problem isn’t the future. The problem is what we’re doing right now. Today, humans spend more than $1 trillion every year on decarbonization, which will most likely have no measurable effect on our future climate. But it does raise the price of energy, and the current virtue-signaling environment prevents people in the developing world from reaching the standard of living we take for granted.

Today, life expectancy in sub-Saharan Africa is 60 years — the same as it was in the United States in 1935. Today, about 60 percent of sub-Saharan people are farmers the same as in the US in 1860. About 500 million people in Africa live in extreme poverty. According to the World Bank, half the countries in Sub-Saharan Africa have poverty rates higher than 35%.

And yet, that same World Bank won’t lend them money to build a reliable energy grid. The United Nations and the World Economic Forum are forcing Africans to install solar and wind projects that can’t help them cook dinner, so they continue to burn trees, charcoal, and dung, destroying forests and dying of lung diseases. They are — right now — being forced to live lives we lived in 1850.

Yes, you say, but prices of solar panels are coming down! Imagine you have a car that drives really well whenever the sun is shining or the wind is blowing. No batteries, nothing, it just works. It’s not even that expensive, and it is magically zero emission. Now, can you get rid of your regular car? Or do you need to have your own back-up car for whenever the sun isn’t shining or wind isn’t blowing? You might think you could just rent or use an Uber then, but that’s exactly when everyone else needs a car, too, so you actually have to maintain your existing car, pay the insurance, make sure it’s always available, for those times when your renewable car isn’t possible and the Uber is taken. That’s twice as many cars, no matter who owns them. That’s not “sustainability.”

Summary

As you have just learned, we live in the safest century to be alive. We are more protected against natural disasters than ever. And we are being lied to about CO2 and climate.

This isn’t easy for a lot of people to hear. It has become a matter of tribal and political identity. I know. In 1991, I wrote a book about how CO2 was changing the climate. But then I dug deeper and realized not everything was as it seemed. When I started to tell others the science wasn’t settled, I lost quite a few friends. If you have read this far, thank you for being brave. I invite you to take the next step at Climatecurious.com.

Resources

Wikipedia article on the Great Famine of 1876

A partial explanation of the ocean oscillations that caused the Great Famine of 1876

Climate and the Global Famine of 1876–78

Climate Curious — a resource for all to learn more about CO2 and climate.

How the British Empire exacerbated a rare climate event.

How the event was covered up (warning: very graphic images) …

The Top FIVE Climate Change LIES

by L. Fox, Nov 28, 2022 in ClimateChangeDispatch


Laurence Fox breaks apart the lies repeatedly fed to the public and details the manipulation by the billionaire-funded lobby groups and activists.

If you’re skeptical about climate change or the impact of the environment on our planet, this video is for you.

Climate Lie Number One: Wind Power Is NINE Times CHEAPER Than Gas

Climate Lie Number Two: Island Countries Are SINKING Into The Sea

Climate Lie Number Three: Net Zero WILL Make YOUR Bills Cheaper

Climate Lie Number Four: Storms Are Getting MORE Frequent And MORE Intense

Climate Lie Number Five: Climate Change Is KILLING People

WATCH: