Full-time professor at the Free University of Brussels, Belgium
apreat@gmail.com
apreat@ulb.ac.be
• Department of Earth Sciences and Environment
Res. Grp. - Biogeochemistry & Modeling of the Earth System
Sedimentology & Basin Analysis
• Alumnus, Collège des Alumni, Académie Royale de Sciences, des Lettres et des Beaux Arts de Belgique (mars 2013). http://www.academieroyale.be/cgi?usr=2a8crwkksq&lg=fr&pag=858&rec=0&frm=0&par=aybabtu&id=4471&flux=8365323
• Prof. Invited, Université de Mons-Hainaut (2010-present-day)
• Prof. Coordinator and invited to the Royal Academy of Sciences of Belgium (Belgian College) (2009-
present day)
• Prof. partim to the DEA (third cycle) led by the University of Lille (9 universities from 1999 to 2004) - Prof. partim at the University of Paris-Sud/Orsay, European-Socrates Agreement (1995-1998)
• Prof. partim at the University of Louvain, Convention ULB-UCL (1993-2000)
• Since 2015 : Member of Comité éditorial de la Revue Géologie de la France http://geolfrance.brgm.fr
• Since 2014 : Regular author of texts for ‘la Revue Science et Pseudosciences’ http://www.pseudo-sciences.org/
• Many field works (several weeks to 2 months) (Meso- and Paleozoic carbonates, Paleo- to Neoproterozoic carbonates) in Europe, USA (Nevada), Papouasia (Holocene), North Africa (Algeria, Morrocco, Tunisia), West Africa (Gabon, DRC, Congo-Brazzaville, South Africa, Angola), Iraq... Recently : field works (3 to 5 weeks) Congo- Brazzaville 2012, 2015, 2016 (carbonate Neoproterozoic).
Degree in geological sciences at the Free University of Brussels (ULB) in 1974, I went to Algeria for two years teaching mining geology at the University of Constantine. Back in Belgium I worked for two years as an expert for the EEC (European Commission), first on the prospecting of Pb and Zn in carbonate environments, then the uranium exploration in Belgium. Then Assistant at ULB, Department of Geology I got the degree of Doctor of Sciences (Geology) in 1985. My thesis, devoted to the study of the Devonian carbonate sedimentology of northern France and southern Belgium, comprised a significant portion of field work whose interpretation and synthesis conducted to the establishment of model of carbonate platforms and ramps with reefal constructions.
I then worked for Petrofina SA and shared a little more than two years in Angola as Director of the Research Laboratory of this oil company. The lab included 22 people (micropaleontology, sedimentology, petrophysics). My main activity was to interpret facies reservoirs from drillings in the Cretaceous, sometimes in the Tertiary. I carried out many studies for oil companies operating in this country.
I returned to the ULB in 1988 as First Assistant and was appointed Professor in 1990. I carried out various missions for mining companies in Belgium and oil companies abroad and continued research, particularly through projects of the Scientific Research National Funds (FNRS).
My research still concerns sedimentology, geochemistry and diagenesis of carbonate rocks which leads me to travel many countries in Europe or outside Europe, North Africa, Papua New Guinea and the USA, to conduct field missions.
Since the late 90's, I expanded my field of research in addressing the problem of mass extinctions of organisms from the Upper Devonian series across Euramerica (from North America to Poland) and I also specialized in microbiological and geochemical analyses of ancient carbonate series developing a sustained collaboration with biologists of my university. We are at the origin of a paleoecological model based on the presence of iron-bacterial microfossils, which led me to travel many countries in Europe and North Africa. This model accounts for the red pigmentation of many marble and ornamental stones used in the world. This research also has implications on the emergence of Life from the earliest stages of formation of Earth, as well as in the field of exobiology or extraterrestrial life ...
More recently I invested in the study from the Precambrian series of Gabon and Congo. These works with colleagues from BRGM (Orléans) are as much about the academic side (consequences of the appearance of oxygen in the Paleoproterozoic and study of Neoproterozoic glaciations) that the potential applications in reservoir rocks and source rocks of oil (in collaboration with oil companies).
Finally I recently established a close collaboration with the Royal Institute of Natural Sciences of Belgium to study the susceptibility magnetic signal from various European Paleozoic series. All these works allowed me to gain a thorough understanding of carbonate rocks (petrology, micropaleontology, geobiology, geochemistry, sequence stratigraphy, diagenesis) as well in Precambrian (2.2 Ga and 0.6 Ga), Paleozoic (from Silurian to Carboniferous) and Mesozoic (Jurassic and Cretaceous) rocks. Recently (2010) I have established a collaboration with Iraqi Kurdistan as part of a government program to boost scientific research in this country.
My research led me to publish about 180 papers in international and national journals and presented more than 170 conference papers. I am a holder of eight courses at the ULB (5 mandatory and 3 optional), excursions and field stages, I taught at the third cycle in several French universities and led or co-managed a score of 20 Doctoral (PhD) and Post-doctoral theses and has been the promotor of more than 50 Masters theses.
European Parliament backs listing nuclear energy, gas as ‘green’
The push to label natural gas and nuclear energy as “green” in order to lure in more private investors was met with heavy resistance. But EU lawmakers ultimately gave it the green light.
The European Parliament on Wednesday voted in favor of a proposal regarding labeling natural gas and nuclear power plants as climate-friendly investments.
The European Commission released the proposal, formally called the EU taxonomy, in December as a list of economic activities that investors can label and market as green in the EU.
A motion to block the proposal received 278 votes in favor and 328 against, while 33 lawmakers abstained.
Unless 20 of the EU’s 27 member states oppose the proposal, it will be passed into law.
by H.S. Sterling, Jul 6, 2022 in ClimateChangeDispatch
In a refreshingly honest article in the Logan Daily News, author Bud Simpson cites data from research showing deaths from non-optimal temperatures are declining amid climate change.
Simpson is right and he and the Logan Daily News are to be congratulated for discussing this important truth about climate change. [bold, links added]
In a Logan Daily News article, titled “My last global warming column?”, Simpson describes how after examining the facts over time, he went from being a firm believer that human activities were causing dangerous climate change to realizing no climate catastrophe is in the offing.
“Carbon dioxide was, and is, bandied about as if it were the biggest demon on the face of the earth,” writes Simpson. “In truth, it is one of the most valuable of gases and contributes hugely to a better life for us earthlings. … Proponents of this group even tried to get carbon dioxide labeled as a toxic gas! If that were true, we’d all be dead by now. And without any warming.”
Among the research Simpson discovered that convinced him climate change was not, in fact, threatening human survival was a study published in the prominent peer-reviewed journal, The Lancet, which firmly established:
“…that worldwide, cold kills about 17 times more people than heat does. A group of 22 scientists studied over 74 million deaths in the U.S., China, Brazil, and ten other countries. The findings showed that cold caused 7.29 percent of the deaths while heat caused 0.42 percent.”
These much warmer Greenland temperatures imply that the elevation of the ice sheet was 400 meters lower than it is today from about 6,000 to 10,000 years ago.
Scientists (Westhoff et al., 2022) report that the two largest Greenland melt events in the last few hundred years occurred in 2012 and in 1889 CE – when atmospheric CO2 levels were still under 300 ppm.
The “melt events around the Holocene Climate Optimum were more intense and more frequent” than has been observed during the modern period. And the most prominent melt events of the last 10,000 years centered around the Medieval Warm Period, 986 CE.
Overall, the elevation of the Greenland ice sheet has grown by 0.4 km since the Early Holocene, as “summer temperatures must have been at least 3 ± 0.6°C warmer during the Early Holocene compared to today.”
by P. Homewood, Jul 5, 2022 in NotaLotofPeopleKnowThat
Jørgen Peder Steffensen is an Associate Professor at the University of Copenhagen and one of the world’s leading experts on ice cores. Using ice cores from sites in Greenland, he has been able to reconstruct temperatures there for the last 10000 years. So what are his conclusions?
Temperatures in Greenland were about 1.5 C warmer 1000 years ago than now.
It was perhaps 2.5 C warmer 4000 years ago.
The period around 1875, at the lowest point of the Little Ice Age, marked the coldest point in the last 10,000 years.
Other evidence from elsewhere in the Northern Hemisphere confirms this picture.
Pielke notes five points of fact about hurricanes:
The Intergovernmental Panel on Climate Change (IPCC) finds “no consensus” on the relative role of human influences on Atlantic hurricane activity, quoting the IPCC as follows: “there is still no consensus on the relative magnitude of human and natural influences on past changes in Atlantic hurricane activity, … and it remains uncertain whether past changes in Atlantic TC activity are outside the range of natural variability.”
“The IPCC has concluded that since 1900 there is ‘no trend in the frequency of USA landfall events.’ This goes for all hurricanes and also for the strongest hurricanes, called major hurricanes.”
“Since at least 1980, there are no clear trends in overall global hurricane and major hurricane activity.”
“There are many characteristics of tropical cyclones that are under study and hypothesized to be potentially affected by human influences, … but at present there is not a unified community consensus on these hypotheses, as summarized by the World Meteorological Organization,” as to whether any of the factors are affected by human greenhouse gas emissions.
“Hurricanes are common, incredibly destructive and will always be with us. Even so, we have learned a lot about how to prepare and recover.”
Pielke points out that some of the costliest hurricanes occurred in the early part of the twentieth century when average global temperatures were cooler than at present.
by P. Homewood, Jul 3, 2022 in NotatLotofPeopleKnowThat
By the 1970’s, the Earth had experienced three decades of declining temperatures, which Hubert Lambdescribed as “longest-continued downward trend since temperature records began”.
Many will be aware that the coldest winter on record in the US was that of 1978/79, more than 1F colder than any other year.
The eruption of the Hunga Tonga-Hunga Ha’apai submarine volcano in January 2022 was one of the most explosive volcanic events of the modern era, a new study has confirmed.
Led by researchers from the University of Bath and published today in Nature, the study combines extensive satellite data with ground-level observations to show that the eruption was unique in observed science in both its magnitude and speed, and in the range of the fast-moving gravity and atmospheric waves it created.
Following a series of smaller events beginning in December 2021, Hunga Tonga erupted on 15 January this year, producing a vertical plume that extended more than 50km (30 miles) above the surface of the earth. Heat released from water and hot ash in the plume remained the biggest source of gravity waves on earth for the next 12 hours. The eruption also produced ripple-like gravity waves that satellite observations show extended across the Pacific basin.
The eruption also triggered waves in our atmosphere that reverberated around the planet at least six times and reached close to their theoretical maximum speeds — the fastest ever seen within our atmosphere, at 320m per second or 720 miles per hour.
The fact that a single event dominated such a large region is described by the paper’s authors as unique in the observational record, and one that will help scientists improve future atmospheric weather and climate models.
World leaders at the G7 summit in Germany signaled they will turn back to fossil fuels despite their commitments to a green energy transition thanks to the ongoing energy crisis.
The war in Ukraine is heavily restricting fuel imports, with Russia cutting off European access to the Nord Stream pipeline and the US imposing a fuel embargo on Putin. [bold, links added]
As a result, the U.S. and European countries are abandoning their climate agenda to return to fossil fuels.
Amid skyrocketing fuel prices, the Biden administration has been forced to abandon certain planks of its climate agenda.
Biden called for a temporary increase in domestic fuel production two weeks ago and also asked Congress to suspend the federal per-gallon gas tax for three months last week.
“The G7 leaders are pretending that nothing has happened to the green agenda,” Benny Peiser, director of the Global Warming Policy Forum, told The Daily Caller News Foundation. “In reality, if you look at individual member states… it’s quite obvious that the green agenda will be sunk.”
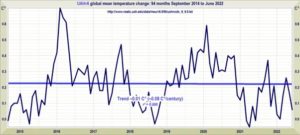
The New Pause paused last month because I was ill. Many apologies for the interruption. Now, however, it resumes – and it has lengthened from 7 years 7 months to the end of April 2022. To the end of June 2022, the New Pause is now 7 years 10 months in length:
This Pause, like its predecessor, which was an impressive 18 years 8 months (UAH), or 18 years 9 months (HadCRUT4), is, as always, not cherry-picked. It is derived from the UAH monthly global mean lower-troposphere temperature anomalies as the period from the earliest month starting with which the least-squares linear-regression trend to the most recent month for which data are available does not exceed zero. Whatever the data show, I show. Or, in the immortal words of Dr Roy Spencer, speaking of his dataset, “It is what it is”. In that splendid dictum speaks all true science.
The least-squares trend, which Professor Jones at the University of East Anglia used to recommend as the simplest and most robust method of deriving global-temperature trends, takes due account of all monthly values, not merely of the starting and ending values.
It is widely accepted that atmospheric pO2 < 1 ppm before the Great Oxidation Event. Yet a recent study found fossil micrometeorites (MMs) containing the oxidized iron species wüstite (FeO) and magnetite (Fe3O4) formed 2.7 billion years ago (Ga). How these MMs became oxidized is uncertain. Abundant O2 in the upper atmosphere and iron oxidation by CO2 have been suggested. However, photochemical reactions cannot produce sufficient O2, and oxidation by CO2 can only produce FeO, each individually failing to explain the formation of Fe3O4-only MMs. Using an oxidation model of iron MMs including photochemistry, we show that a >32% CO2 Archean atmosphere and different entry angles can generate the Fe3O4-only and Fe-FeO mixed composition MMs that have been discovered. Oxidation happens in two stages: by CO2 under brief melting, then by O2. Our results challenge existing constraints on Earth’s atmospheric CO2 concentration at 2.7 Ga and support a warm Late Archean despite the ‘faint young Sun’.
Could Antarctica’s ‘Doomsday Glacier’ meet its doom within 3 years?
“Time is melting away for one of Antarctica’s biggest glaciers, and its rapid deterioration could end with the ice shelf’s complete collapse in just a few years,” alarmist researchers warned at a virtual press briefing on Dec. 13, 2021 at the annual meeting of the American Geophysical Union (AGU)–a once outstanding professional society, but now a shill for the left.
Above is the first sentence of the article titled “Antarctica’s ‘Doomsday Glacier’ could meet its doom within 3 years,” not what we would expect to see from a once reputable source, the AGU. It warns us that in a few years, the world’s largest glacier, about the size of Florida, will melt and raise ocean levels by up to 3 meters (about 10 ft). It then tells us that the glacier is melting from below because the surrounding ocean waters have been warmed “thanks to human-induced climate change.” Finally, it tells us that a team of more than 100 scientists from the USA and the UK have been studying the Thwaites glacier and sharing their findings with scientists worldwide.
The article then explains that the Thwaites is not melting from above, but “the melting is coming from below,” from the warmed-up oceans that have been warmed by human-made CO2 and the greenhouse effect. The bulk of the article then proceeds to detail the forecasted consequences around the world:
…
This team may not have even been communicating with each other. Almost a decade earlier, geologists were seeing evidence of volcanoes in a known active tectonic plate boundary, buried under the glacier and the oceans. Before 2017, at least 47 volcanoes were found in western Antarctica and around the area of the Thwaites glacier. In 2017 the Guardian reported that an additional 91 volcanoes had been found along the western shores of Antarctica, with some sitting under the Twaites glacier itself. See the article “Scientists discover 91 volcanoes below Antarctic ice sheet.”
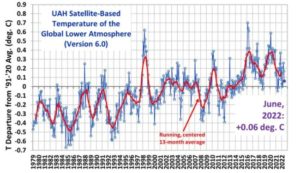
The tropical (20N-20S) anomaly for June was -0.36 deg. C, which is the coolest monthly anomaly in over 10 years, the coolest June in 22 years, and the 9th coolest June in the 44 year satellite record.
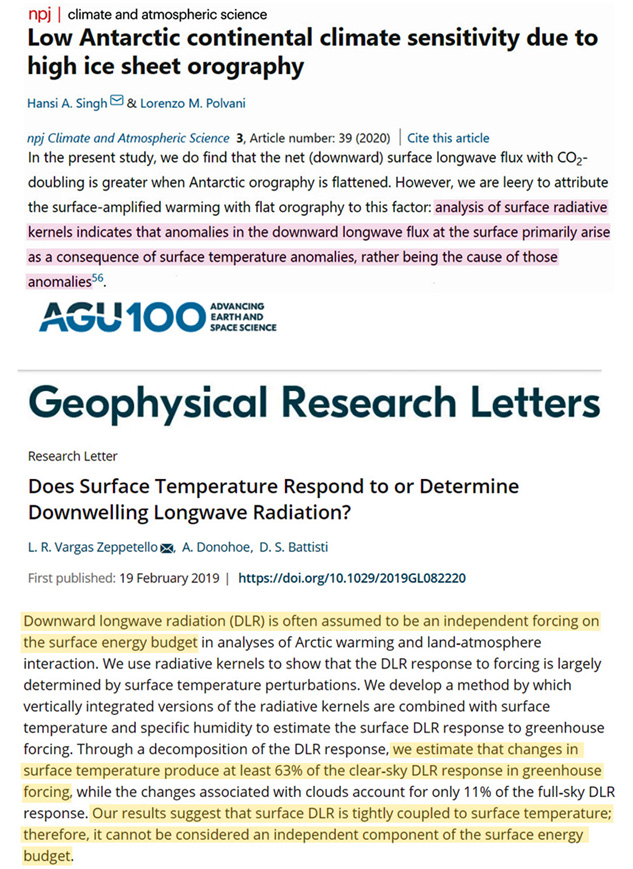
CO2 and water vapor greenhouse effect impacts are not independent climate forcings . A new study affirms the “variance in the radiance in these channels is primarily controlled by…temperature” and “atmospheric absorption is strongly saturated in these [CO2, water vapor] channels”.
It has previously been established that greenhouse gas (water vapor, CO2) forcing “cannot be considered an independent component of the surface energy budget” because “anomalies in the downward longwave flux at the surface primarily arise as a consequence of surface temperature anomalies, rather than being the cause of those anomalies” (Singh and Polvani, 2020, Zeppetello et al., 2019).
Feldman et al. (2015) admit they had to “construct” model-based spectra to simulate a CO2 signal in their seminal paper purporting to show CO2 changes cause temperature changes. This is because the temperature and water vapor levels primarily determine the overall longwave forcing (clear-sky) trends.
by R. Barmby, Jun23, 2022 in ClimateChangeDispatch
When speaking about the Intergovernmental Panel on Climate Change (IPCC) report Climate Change 2021: The Physical Sciences Basis, UN Secretary-General António Guterres declared it a “code red for humanity.”
He further stressed, “The alarm bells are deafening, and the evidence is irrefutable.” [bold, links added]
But a person who reads the report dispassionately and thoroughly will recognize that there is no code red for humanity and that the evidence is indeed refutable. It would be more accurate to say the report is a code red for sanity.
Classical science observes what is; that’s the evidence. A political agenda persuades what should be done; that’s the alarm bells.
Let’s turn off the alarm the IPCC pulled by examining Climate Change 2021: The Physical Science Basis (referred to from this point as “the report”).
The report has four major themes where the political agenda has overrun classical science.
Theme 1: Climate history was altered.
The IPCC would like you to believe that the Earth’s temperature has been constant for thousands of years and that the approximate 1°C of warming is unprecedented.
The report offers this figure to support that view:
Assessing the role of anthropogenic warming from temporally inhomogeneous historical data in the presence of large natural variability is difficult and has caused conflicting conclusions on the detection and attribution of tropical cyclone (TC) trends. [bold, links added]
Here, using a reconstructed long-term proxy of annual TC numbers together with high-resolution climate model experiments, we show robust declining trends in the annual number of TCs at global and regional scales during the twentieth century.
The Twentieth Century Reanalysis (20CR) dataset is used for reconstruction because, compared with other reanalyses, it assimilates only sea-level pressure fields rather than utilizing all available observations in the troposphere, making it less sensitive to temporal inhomogeneities in the observations.
It can also capture TC signatures from the pre-satellite era reasonably well.
The declining trends found are consistent with the twentieth-century weakening of the Hadley and Walker circulations, which make conditions for TC formation less favorable.
Human activities are estimated to have caused ~1.0 °C of global warming above pre-industrial levels, with most of the warming occurring since the mid-twentieth century1.
In bubbling vents off the coast of Ischia, a volcanic island in the Gulf of Naples, lives a curious population of black sea urchins. For at least 30 years, they have lived in these low pH, carbon dioxide-rich environments — a proxy for climate change-induced acidic oceans.
Now, University of Sydney researchers have determined they can also tolerate unprecedentedly warm sea temperatures — another climate change by-product. This means that these urchins, already one of the most abundant animals in the Mediterranean Sea, will likely plunder further afield as oceans continue to warm and become more acidic.
The researchers have described their findings in Biology Letters, a publication of the Royal Society.
The Mediterranean Sea is warming 20 percent faster than the global average, with predicted warming of up to 5.8°C by 2100.
“Given their ability to withstand a large temperature range, these sea urchins are likely to continue spreading throughout the Mediterranean Sea, with serious consequences for coastal habitats,” said lead researcher, University of Sydney marine biologist Dr Shawna Foo.
After a warning from the head of three power companies, France’s government has announced that it will restart a coal-fired plant this winter.
A coal-fueled power plant in the north-east of France is due to be restarted by the country’s government this winter in order to better combat energy insecurity resulting in part due to ongoing hostilities with Russia.
The announcement that the Saint-Avold will be brought back online comes shortly after the heads of three major energy companies in France warned that the general public must “immediately” cut back on energy use to better enable officials to better handle energy insecurity.
According to broadcaster RTL, officials have said that the coal-fired plant is being brought back into service “a precaution, given the Ukrainian situation”.
Le Figaro meanwhile notes officials as saying that they will be including so-called “environmental compensation” as part of the plan to reactivate the plant, with the publication claiming that an environmentally neutral reopening for the plant has been demanded by government.
True primates appeared suddenly on all three northern continents during the 100,000-yr-duration Paleocene–Eocene Thermal Maximum at the beginning of the Eocene, ≈55.5 mya. The simultaneous or nearly simultaneous appearance of euprimates on northern continents has been difficult to understand because the source area, immediate ancestors, and dispersal routes were all unknown. Now, omomyid haplorhine Teilhardinais known on all three continents in association with the carbon isotope excursion marking the Paleocene–Eocene Thermal Maximum. Relative position within the carbon isotope excursion indicates that Asian Teilhardina asiatica is oldest, European Teilhardina belgicais younger, and North American Teilhardina brandti and Teilhardina americana are, successively, youngest. Analysis of morphological characteristics of all four species supports an Asian origin and a westward Asia-to-Europe-to-North America dispersal for Teilhardina. High-resolution isotope stratigraphy indicates that this dispersal happened in an interval of ≈25,000 yr. Rapid geographic dispersal and morphological character evolution in Teilhardina reported here are consistent with rates observed in other contexts.
A new study reports there has been a -0.3°C cooling in the Southern Ocean since 1982 per multiple observational data sets. The authors detail the “failure of CMIP5 models in simulating the observed SST cooling in the Southern Ocean.”
If you want proof of mainstream media manipulation and agenda driving drivel, you need look no further than the “official” reporting of the Greenland ice sheet–the poster child for anthropogenic global warming. If today’s intensifying energy crisis wasn’t rooted in said obfuscations, all of this would be laughable.
Impressive surface mass balance (SMB) readings –a calculation to determine the ‘health’ of a glacier– have been posted across the Greenland ice sheet all season. But the cherry, at least for me, is taken by Saturday’s record-smashing 7 Gigaton GAIN–particularly when you consider the glacier should be losing mass at this time of year.
The MSM appears to love dumb, decontextualized headlines to advance their AGW narrative. So here’s one for them:
Greenland’sRecent SMB Gains Enough To Bury Central Park, New York City Under 7,833 Feet Of Ice…(it’s true, do the math).
This overhasty and ideologically charged energy policy is clearly reflected above all in the rapidly rising electricity prices. In parallel, the price of gas has quadrupled and German gas storage facilities are at an all-time low.
This is not only what I say, but also what the Wall Street Journal says. This overhasty and ideologically charged energy policy is clearly reflected in the rapidly rising electricity prices. Currently, we consumers pay 0.346 Euros per kWh, which is the highest electricity price in the world. And the trend is still rising, because at the end of 2021, three of the last six nuclear power plants and several coal-fired power plants in Germany will also be shut down as part of the hasty energy turnaround, further exacerbating the overall situation. In parallel, the price of gas has quadrupled and German gas storage facilities are at a low. In addition, the North Stream 2 gas pipeline has been put on hold for the time being and the country is engaged in dangerous verbal sparring with Russia, on which it is largely dependent. So all in one suboptimal.
The head of the Kiel Institute for the World Economy, Prof. Dr. Stefan Kooths, also attests to the failure of politics and that it is lying into its own pocket – all this at our expense. Not only are we endangering the country’s security of supply, but also our competitiveness.
Germany is pushing for Group of Seven nations to walk back a commitment that would halt the financing of overseas fossil fuel projects by the end of the year, according to people familiar with the matter. That would be a major reversal on tackling climate change as Russia’s war in Ukraine upends access to energy supplies.
A draft text shared with Bloomberg would see the G-7 “acknowledge that publicly supported investment in the gas sector is necessary as a temporary response to the current energy crisis.”
The caveat in the proposal is that such funding is done “in a manner consistent with our climate objectives and without creating lock-in effects.”
The text remains under debate and could change before G-7 leaders hold their summit in the Bavarian Alps starting Sunday hosted by Chancellor Olaf Scholz. The UK opposes the proposal, two of the people said. A German government spokesman declined to comment.
A person familiar with the discussions said Italy wasn’t actively opposing the German proposal. Italy, like Germany, is highly dependent on Russian gas. On Friday, speaking during a press conference in Brussels, Prime Minister Mario Draghi said Italy has managed to reduce Russian gas imports from 40% last year to 25% at the moment. This has been possible also by signing new gas deals in countries including Congo, Algeria and Angola.
…
Germany has responded to the cuts by reviving coal plants and providing financing to secure gas supplies, while continuing with plans to phase out nuclear energy. The World Nuclear Association, an industry lobby group, is urging the G-7 to boost access to nuclear technologies.
It’s hot. Real hot. Heat waves in the United States surely must be the most visible and impactful sign of human caused climate change, right? Well, actually no. Let’s take a look at what the U.S. National Climate Assessment and the Intergovernmental Panel on Climate Change say about heat waves in the United States. What they say may surprise you.
Before proceeding, let me emphasize that human-caused climate change is real and significant. Aggressive policies focused on both adaptation and mitigation make very good sense. So too does being accurate about current scientific understandings. The importance of climate change does not mean that we can ignore scientific integrity — actually the opposite, it makes it all the more important. So let’s take a close look at recent assessment reports and what they say about U.S. heat waves.
The figure below comes out of the most recent U.S. National Climate Assessment(NCA). It shows the frequency (top) and intensity (bottom) of heat waves in the U.S. since 1900. The bottom figure is actually based on a paper that I co-authored in 1999, which serves as the basis for an official indicator of climate change used by the Environmental Protection Agency.
..
La géologie, une science plus que passionnante … et diverse