A new research study from The University of Alabama in Huntsville, a part of the University of Alabama System, addresses a central question of climate change research: how much warming can be expected from adding carbon dioxide to the atmosphere through fossil fuel burning and other activities as standards of living increase around the world? [emphasis, links added]
UAH Earth System Science Center Research Scientist Dr. Roy Spencer and UAH Earth System Science Center Director and Alabama State Climatologist Dr. John R. Christy have spent 10 years developing a one-dimensional climate model to answer this elusive question.
Their latest research study was published in the September 2023 issue of Theoretical and Applied Climatologyjournal titled: “Effective climate sensitivity distributions from a 1D model of global ocean and land temperature trends, 1970–2021.”
Spencer and Christy’s climate model, based upon objective measured data, found carbon dioxide does not have as big of an effect on the warming of the atmosphere when compared with other climate models.
“For over 30 years, dozens of highly sophisticated, computerized climate models based upon theory have been unable to agree on an answer. That’s why we developed our own one-dimensional climate model to provide an answer,” says. Dr. Spencer.
Current climate models range over a factor of three, from 1.8 to 5.6° Celsius, in the amount of warming produced in response to a doubling of atmospheric carbon dioxide (CO2).
This warming response to doubled carbon dioxide is called “effective climate sensitivity.” Determining its magnitude has remained elusive for decades.
When compared to other current climate models, the research results from Spencer and Christy’s one-dimensional climate model approached the bottom end of the range, 1.9° Celsius.
The lower UAH value indicates that the climate impact of increasing carbon dioxide concentrations is much less [than] that based on other climate models.
“An important assumption of our model, as well as the more complex models used by others, is that all climate change is human-caused,” Spencer states. “If recent warming is partly natural, it would further reduce climate sensitivity.”
What distinguishes this model developed at UAH from others is that it is driven by actual observations of warming, rather than theoretical assumptions about how the climate system responds to increasing greenhouse gases.
The one-dimensional climate model uses a variety of observational datasets of warming between 1970 and 2021 of the deep ocean and land, along with associated uncertainty ranges.
These datasets produced a range of estimates of climate sensitivity based on basic concepts of energy conservation.
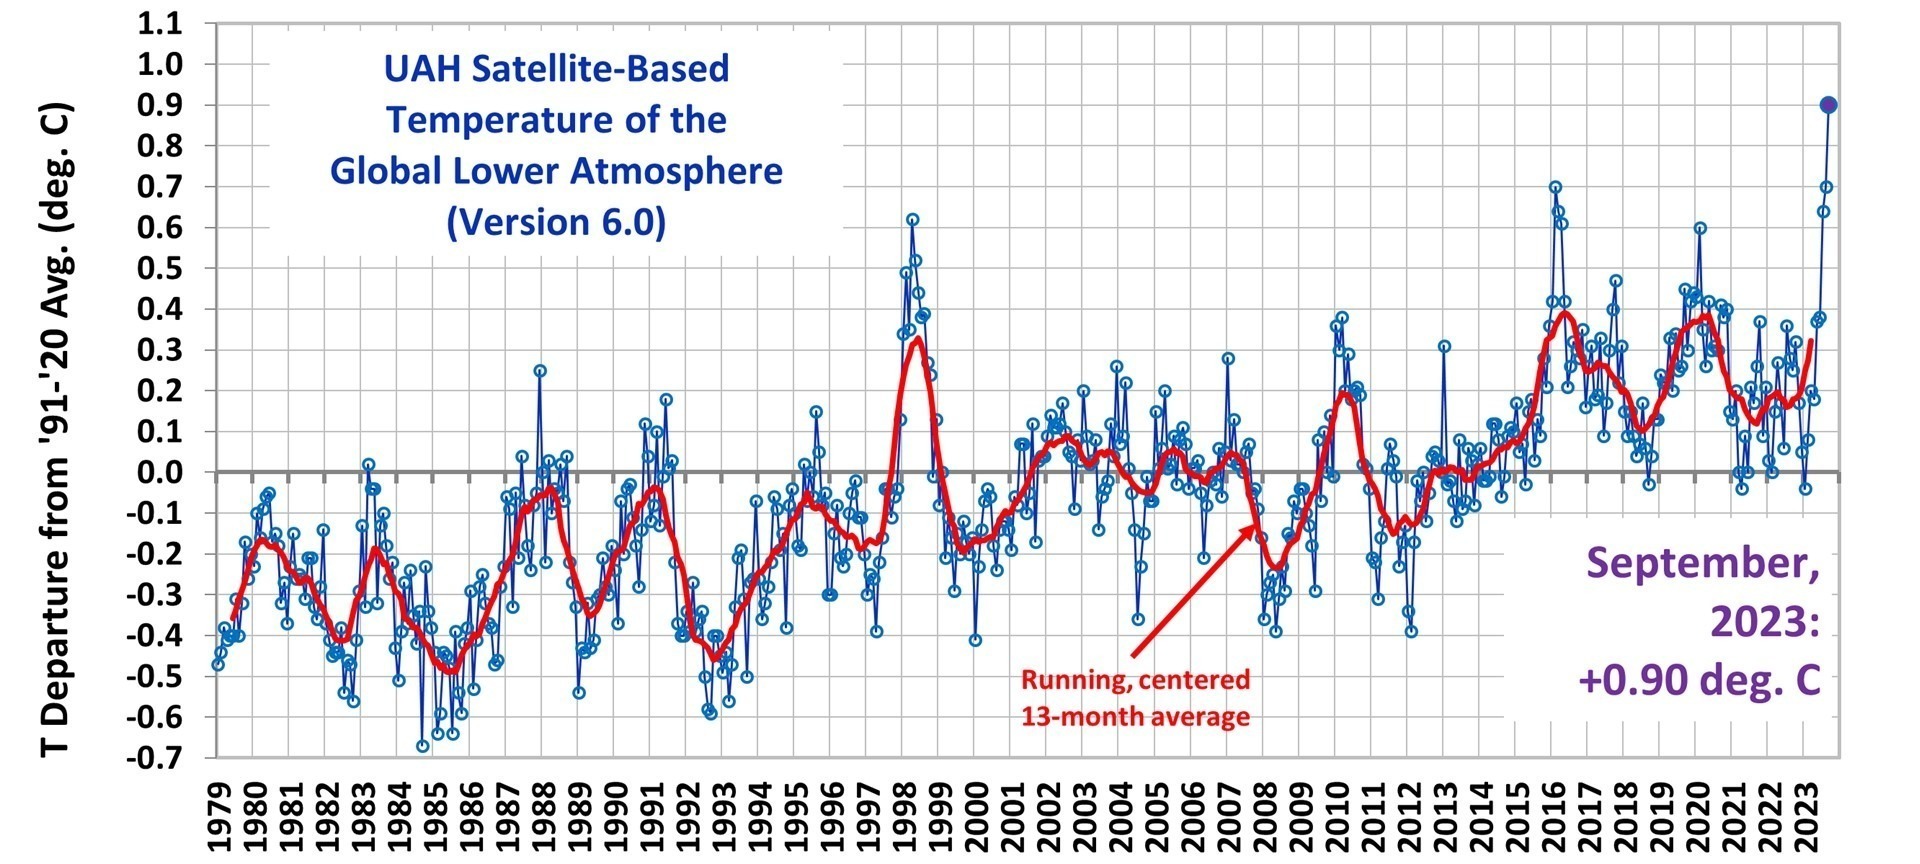
“The 52-year period since 1970 is key. It represents the period of most rapid warming, with the highest confidence in the observational data of deep ocean warming,” Spencer states.
The results of Spencer and Christy’s research also showed a period of the most rapid growth in atmospheric carbon dioxide.
This is due to their climate model accounting for heat storage in deeper layers of land, which other climate models ignore.
A critical advantage of their simple model is that it conserves energy.
“It should be a requirement that any physics-based model of global warming should meet,” Spencer says. “Current computerized climate models continue to have difficulty achieving this aspect.”
The model is simple enough that other scientists can easily adapt it to updated or improved global temperature measurements as they become available.


