Archives de catégorie : climate-debate

A Brief Summary Of How ‘Global Warming’ Science Has Changed Since 1998

by K. Richard, Mar 31, 2022 in NoTricksZone


Two weeks before Dr. Michael E. Mann and colleagues published their 23 April 1998 “hockey stick” chart in Nature, a peer-reviewed journal published a paper asserting “an overwhelming majority of climate scientists” (50 out of 60) view catastrophic human-caused global warming – and even global warming itself – as an “unsupported assumption”.

At the time, satellite data indicated the lower troposphere had cooled by 0.13°C between 1979 and 1994. The Arctic had cooled by -0.88°C since the 1940s.

It was thought the IPCC had just (1995) perpetrated a “disturbing corruption of the peer-review process” in manipulating the conclusions of scientists to support favored government policies.

AR6 and Sea Level Rise, Part 1

by Andy May, Mar 19, 2022 in WUWT


This is the first of a three-part series on the IPCC’s discussion of sea level rise in their latest report, AR6 (IPCC, 2021). The report claims that the rate of sea level rise is accelerating. It is fair to ask why they think this, what evidence do they offer?

We find the following in the AR6 Summary for Policymakers:

“Global mean sea level increased by 0.20 [0.15 to 0.25] m between 1901 and 2018. The average rate of sea level rise was 1.3 [0.6 to 2.1] mm yr–1 between 1901 and 1971, increasing to 1.9 [0.8 to 2.9] mm yr–1 between 1971 and 2006, and further increasing to 3.7 [3.2 to 4.2] mm yr–1 between 2006 and 2018 (high confidence). Human influence was very likely the main driver of these increases since at least 1971.” [Bold added]

AR6 Summary for Policymakers, page SPM-6 (IPCC, 2021)

New Study: The CO2-Drives-Global-Warming ‘Concept’ Is ‘Obsolete And Incorrect’

by Lightfoot & Ratzer,  Mar 14, 2022 in NoTricksZone/JBasicApplSci


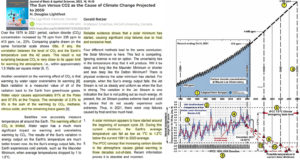
In analyzing UAH global temperature and Mauna Loa CO2 records from 1979 to 2021, climate researchers Lightfoot and Ratzer (2022) report there has been “little, if any” correlation between these two variables during this period.

They assert that between 91 and 98% of Earth’s greenhouse gas effect is from water vapor, as CO2 and other trace gases contribute less than 5% to greenhouse gas forcing.

A solar minimum has just began in the current solar cycle 25. The declining solar output is projected to eventually lead to a ~1 to 1.2°C cooling over the next 30 to 40 years. Solar minimum periods are also accompanied by crop failures due to frost and weather extremes delivering excessive heat.

The authors conclude by suggesting the popularized conceptualization of CO2 as a driver of global warming has proven to be “obsolete and incorrect”.

Al Gore’s 2009 Warning on Vanishing Polar Ice and the Perils of Censoring ‘Misinformation’

by J. Miltimore, Mar 17, 2022 in FEEStories


While speaking at a climate change summit in Denmark in 2009, former Vice President Al Gore made an alarming statement.

Citing research from Dr. Wieslaw Maslowski, a professor of oceanography at the Naval Postgraduate School in California, Mr. Gore said it was likely that the north polar ice caps would soon be completely melted.

“These figures are fresh,” Mr. Gore said. “Some of the models suggest to Dr. Maslowski that there is a 75 percent chance that the entire north polar ice cap, during the summer months, could be completely ice-free within five to seven years.”

New Analysis Of Greenland’s GISP2 Temperatures Expose Selection Bias In Paleo Reconstructions

by K. Richard, Mar 17, 2022 in NoTricksZone


Scientists admit that 3 different Greenland Summit (GISP2) temperature reconstruction “strategies” produce 3 different paleoclimate temperature results. The reconstructions chosen as the most “robust” are therefore the ones that align best with the authors’ presuppositions.

In a new study published in Quaternary Science Reviews scientists (Döring and Luenberger, 2022) report they reject a reconstruction of Greenland Summit temperatures that shows it has cooled ~4°C since Roman times (shown below as the red trend line, extended to 2000 C.E.).

Northern and Southern Hemisphere Warming

by A. May, Mar 18, 2022 in WUWT


As shown in Figure 1, the Hadley Climatic Research Unit HadCRUT5 temperature dataset suggests the Northern Hemisphere warmed 0.74°C (1.3° F) more than the Southern Hemisphere from 1979 through 2021. The UAH satellite temperature lower troposphere record is directionally similar but the difference between the hemispheres is much less, as shown in Figure 2. Both figures have identical vertical scales of 1.4°C. The UAH global satellite warming difference, from 1979 to 2021, between the hemispheres is about 0.2°C (0.4° F), less by more than a factor of 3.

Conclusions

The UAH and HadCRUT5 records both show the Northern Hemisphere warming more rapidly than the Southern, but the amount of extra warming in the HadCRUT5 record is anomalous. While the Southern Hemisphere satellite and surface rates are similar, the Northern Hemisphere rates are very different.

The global UAH lower troposphere and HadSST4 warming rates are both 0.14°C/decade from 1979 to 2020, the same to two decimals, as shown in my previous post. The oceans cover 70% of Earth’s surface and the HadSST4 dataset is used in combination with the CRUTEM5 land-surface temperature record to produce the curves in Figure 1. Given this, the large difference in Northern Hemisphere warming rates between Figures 1 and 2 is very hard to explain. Frankly, it suggests there is a problem with CRUTEM5. Figure 3 suggests the problem is getting worse in recent years, not better. This topic is discussed in more detail in my latest book: The Great Climate Change Debate: Karoly v Happer.

Ancient El Niños reveal limits to future climate projections

by University of Texas at Austin, Mar 15, 2022 in ScienceDaily


The climate pattern El Niño varies over time to such a degree that scientists will have difficulty detecting signs that it is getting stronger with global warming.

That’s the conclusion of a study led by scientists at The University of Texas at Austin that analyzed 9,000 years of Earth’s history. The scientists drew on climate data contained within ancient corals and used one of the world’s most powerful supercomputers to conduct their research.

The study of the past, which was recently published in Science Advances, was motivated by the need to get a clearer picture of how climate change may affect El Niño in the future.

El Niño is the warm phase of the El Niño Southern Oscillation, a climate phenomenon that sets the stage every few years for weather patterns worldwide. Strong El Niño events, such as the ones in 1997 and 2015 that brought wildfires to the rainforests of Borneo in Asia and caused widespread bleaching to the world’s coral reefs, happened about once a decade.

Computer models, however, are unclear about whether El Niño events will become weaker or stronger as the world warms due to climate change.

Green Fuel Folly: Forest Thinning (For Wood Pellet Production) Has A Profound Surface Warming Impact

by P. Gosselin, Mar 15, 2022 in NoTricksZone


4 recent studies tell us that forest thinning for the production of wood pellets and clear cutting for wind parks are really dumb ideas. 

Reforestation and afforestation (R&A) are among the most prominent ideas for the sequestration of CO2 and thus viewed by alarmists as a climate solution. But others doubt forests play much of a role.

Wood pellets mean double barrel warming

Another solution proposed for climate protection is to burn wood pellets instead of oil and natural gas for heating buildings. Wood pellets are viewed as renewable and thus are supposed to be brakes on climate change. But now recent studies suggest that burning wood pellets coming from harvested trees in forest thinning operations may instead be accelerating warming.

HAT-TIP: Die kalte Sonne here.

Cloud–albedo effects due to land–atmosphere interactions

In their study, “Cloud cooling effects of afforestation and reforestation at midlatitudes” the team of authors led by Sara Cerasoli carefully analyzed R&A at midlatitudes. Using both satellite data and atmospheric boundary-layer models, they show that by including cloud–albedo effects due to land–atmosphere interactions, the R&A cooling at midlatitudes becomes prevalent.

This means that scientists earlier had not adequately taken the clouds that formed due to forests into account. These high albedo clouds play a major role in terms of having a cooling effect. Clouds tend to form more over intact forests than they do over forest-free areas.

Forests along with the clouds they help create, act to cool surface temperatures. Thus efforts to keep forests intact at midlatitudes would help cool the earth’s surface.

Satellite and Surface Temperatures

by A. May, Mar 15, 2022 in WUWT


In the Great Climate Change Debate between Professor David Karoly and Professor Will Happer, Glenn Tamblyn was called upon to finish the consensus side of the debate after Karoly backed out. The details are described in my latest book. The debate contained an illuminating exchange of opinions on satellite versus surface temperature measurements. This is Glenn Tamblyn’s opinion:

“Stitching together raw data from multiple satellites is very complex. Thus, the satellite datasets are much less accurate than the surface temperature datasets.

Professor Happer’s stronger emphasis on satellite temperature measurements does not agree with the experts on the subject.”

(Tamblyn, 2021b, pp. 7-8)

Satellites measure microwave radiation emitted from oxygen atoms in the atmosphere to estimate the “brightness” temperature, which can then be converted to an actual atmospheric temperature. No correlation to any other measurements is required. The measured brightness is compared to the brightness temperature of deep space (-455°F) and a target of known temperature within the satellite to compute the actual temperature in the atmosphere.[1]

Due to interference and clouds, this technique does not work close to the surface, so satellite atmospheric temperatures cannot be directly compared to surface measurements. The satellite measurements are best for measuring air temperatures in the mid-troposphere and the lower stratosphere.

The Hadley Centre has estimated that their best current estimate of global monthly average SST accuracy(sea surface temperature average uncertainty from 2000 to 2021) is about ±0.033°C and David Karoly supplied an estimate of ±0.1°C. This is a bit less accurate than the accuracy Roy Spencer and John Christy estimate for their satellite measurements of ±0.011°C for a monthly average.[1]

Ancient El Niños reveal limits to future climate projections

by University of Texas at Austin, Mar 15, 2022 in ScienceDaily


The climate pattern El Niño varies over time to such a degree that scientists will have difficulty detecting signs that it is getting stronger with global warming.

That’s the conclusion of a study led by scientists at The University of Texas at Austin that analyzed 9,000 years of Earth’s history. The scientists drew on climate data contained within ancient corals and used one of the world’s most powerful supercomputers to conduct their research.

The study of the past, which was recently published in Science Advances, was motivated by the need to get a clearer picture of how climate change may affect El Niño in the future.

El Niño is the warm phase of the El Niño Southern Oscillation, a climate phenomenon that sets the stage every few years for weather patterns worldwide. Strong El Niño events, such as the ones in 1997 and 2015 that brought wildfires to the rainforests of Borneo in Asia and caused widespread bleaching to the world’s coral reefs, happened about once a decade.

Computer models, however, are unclear about whether El Niño events will become weaker or stronger as the world warms due to climate change.

“Much of the world’s temperature and rainfall are influenced by what happens in the tropical Pacific Ocean where El Niño starts,” said the study’s lead author, Allison Lawman, who began the research as a Ph.D. project at the UT Jackson School of Geosciences and is now a postdoctoral researcher at the University of Colorado Boulder. “The difference in rainfall between greater or fewer strong El Niño events is going to be a critical question for infrastructure and resource planners.”

New Study: The CO2-Drives-Global-Warming ‘Concept’ Is ‘Obsolete And Incorrect’

by K. Richard, Mar 14, 2022 in NoTricksZone


“The IPCC concept that increasing carbon dioxide in the atmosphere causes global warming is three decades out-of-date.”  − Lightfoot and Ratzer (2022), Journal of Basic & Applied Sciences

In analyzing UAH global temperature and Mauna Loa CO2 records from 1979 to 2021, climate researchers Lightfoot and Ratzer (2022) report there has been “little, if any” correlation between these two variables during this period.

They assert that between 91 and 98% of Earth’s greenhouse gas effect is from water vapor, as CO2 and other trace gases contribute less than 5% to greenhouse gas forcing.

A solar minimum has just began in the current solar cycle 25. The declining solar output is projected to eventually lead to a ~1 to 1.2°C cooling over the next 30 to 40 years. Solar minimum periods are also accompanied by crop failures due to frost and weather extremes delivering excessive heat.

The authors conclude by suggesting the popularized conceptualization of CO2 as a driver of global warming has proven to be “obsolete and incorrect”.

Image Source: Lightfoot and Ratzer, 2022

Past global photosynthesis reacted quickly to more carbon in the air

by University of Copenhagen, Mar 10, 2022 in ScienceDaily


Ice cores allow climate researchers to look 800,000 years back in time: atmospheric carbon acts as fertilizer, increasing biological production. The mechanism removes carbon from the air and thereby dampens the acceleration in global warming.

Even under ice age conditions will plants, plankton, and other life forms be able to increase production whenever atmospheric carbon concentrations rise. The mechanism will not prevent an ongoing trend of global warming, but at least dampen the acceleration. This conclusion stems from an international collaboration involving the Physics of Ice Climate Earth (PICE) center of Niels Bohr Institute, University of Copenhagen.

“Global biosphere production through photosynthesis is the strongest absorbing flux of atmospheric carbon dioxide. It is therefore essential to understand its natural variability for a better projection of the future carbon cycle,” says Postdoc researcher Ji-Woong Yang, PICE, continuing:

“Nowadays, as we have Earth observation satellites and other advanced equipment, the mechanism of carbon fertilization is well established. However, we were not sure that the same mechanism existed in past periods where the climate was very different and atmospheric carbon concentrations much lower. The new results confirm the existence of the strong correlation and allow us to model future developments with more confidence.”

Eight glacial cycles are covered

In collaboration with Laboratoire des Science du Climat et de l’Environnement, France, the PICE team has studied the ancient air trapped inside tiny air bubbles in an Antarctic ice core. The ice core represents the last 800,000 years of climatic development.

The scientists take advantage of the fact that the oxygen atom does not only exist in the most common form 16O with 8 protons and 8 neutrons but also as the isotopes 17O and 18O. The isotopic composition is a tracer for biosphere productivity. Uniquely, the method will show the global level of biological production in contrast to other methods which give more localized results.

Combining the air bubble measurements with modeling of oxygen behavior in both the biosphere and the stratosphere, the researchers were able to quantify the biosphere productivity evolution under both glacial periods (ice ages) and interglacial periods. In total, eight glacial cycles were covered.

“The results clearly demonstrate that productivity drops during glacial periods and increases during interglacial periods. Further, a strong correlation exists with past atmospheric carbon dioxide concentrations measured from multiple ice cores. In addition, the effect is more prominent during glacial periods where the level of carbon dioxide and the global biosphere productivity start to increase several thousand years before the ice caps begin to melt. This correlation is explained by the strong fertilization effect by atmospheric carbon dioxide,” says Ji-Woong Yang.

There is no climate crisis

by R. Darwall, Mar 7, 2022 in TheSpectator


“No climate crisis” is, of course, not the spin the Intergovernmental Panel on Climate Change (IPCC) is putting on its new 3,676-page report released last month. “The choices we make in the next decade will determine our future,” the IPCC says. “Any further delay in concerted global action will miss a brief and rapidly closing window to secure a liveable future.”

It could hardly be plainer. The report is political advocacy barely masquerading as science.

The IPCC Working Group II report is not meant to be about policy; that’s the job of Working Group III, which has yet to produce its contribution to the sixth assessment report. “The focus of our new report is on solutions,” the IPCC says of the Working Group II report. “It highlights the importance of fundamental changes in society.” The solution to climate change, the IPCC claims, is renewable energy, circular economies, healthy diets, universal health coverage and social protection. The only surprise is that the IPCC didn’t include abolishing the Second Amendment in its climate catechism.

“Scientific evidence shows that addressing the risks and impacts of climate change successfully involves a more a diverse set of actors than previously thought” and involvespartnerships with “traditionally marginalized groups, including women, youth, Indigenous Peoples, local communities and ethnic minorities (high confidence).” How on earth did the IPCC exclude the LBGTQ+ community? “Different interests, values and worldviews can be reconciled if everyone works together,” the IPCC says. This isn’t science. It’s climate kumbaya.

Small islands were the poster child of net zero as they claimed they risked sinking beneath the waves thanks to rising sea levels. They successfully lobbied for the adoption of the target in the Paris climate agreement to limit the increase in global temperature to 1.5 degrees Celsius above pre-industrial levels. The IPCC therefore includes them in a list of global hotspots of high human vulnerability, asserting that their vulnerability will increase in the context of sea level rise. Yet only four years ago, the IPCC in its 1.5 degree Celsius special report stated that “observations, models and other evidence” indicate that unconstrained Pacific atolls have kept pace with sea level rises and that there had been “little reduction in size or net gain in land.”

In a blog post, Roger Pielke Jr. of the department of environmental studies at the University of Colorado Boulder notes that the IPCC lifts projections of future climate damages from studies that eliminate the choice of adapting to climate change, a practice Pielke calls “misleading at best.” Yet buried in the report is a study showing that adequate flood protection, i.e. adaptation, could avoid 95 percent of projected flood damages.

Thawing Permafrost Could Leach Microbes, Chemicals Into Environment

by C. Rotter, Mar 10, 2022 in WUWT


Scientists are turning to a combination of data collected from the air, land, and space to get a more complete picture of how climate change is affecting the planet’s frozen regions.

Trapped within Earth’s permafrost – ground that remains frozen for a minimum of two years – are untold quantities of greenhouse gases, microbes, and chemicals, including the now-banned pesticide DDT. As the planet warms, permafrost is thawing at an increasing rate, and scientists face a host of uncertainties when trying to determine the potential effects of the thaw.

paper published earlier this year in the journal Nature Reviews Earth & Environment looked at the current state of permafrost research. Along with highlighting conclusions about permafrost thaw, the paper focuses on how researchers are seeking to address the questions surrounding it.

Infrastructure is already affected: Thawing permafrost has led to giant sinkholes, slumping telephone poles, damaged roads and runways, and toppled trees. More difficult to see is what has been trapped in permafrost’s mix of soil, ice, and dead organic matter. Research has looked at how chemicals like DDT and microbes – some of which have been frozen for thousands, if not millions, of years – could be released from thawing permafrost.

Then there is thawing permafrost’s effect on the planet’s carbon: Arctic permafrost alone holds an estimated 1,700 billion metric tons of carbon, including methane and carbon dioxide. That’s roughly 51 times the amount of carbon the world released as fossil fuel emissions in 2019. Plant matter frozen in permafrost doesn’t decay, but when permafrost thaws, microbes within the dead plant material start to break the matter down, releasing carbon into the atmosphere.

Sulfur emissions from consumption by developed and developing countries produce comparable climate impacts

by J. Lin et al., Feb 17, 2022 in Nature


Abstract

Regional consumption activities supported by domestic production and international trade have led to substantial aerosol-related emissions worldwide. Here we quantify sulfur dioxide emissions associated with consumption by developed and developing countries and assess the resulting climate impacts using an Earth system model. We find that although the consumption-associated emissions of developed countries are 40% less than those of developing countries, they lead to similar impacts on global mean surface air temperature and precipitation. This is because the effective radiative forcing induced per emission is greater for developed countries, which we attribute to the emissions being located at higher northern latitudes and being more evenly distributed zonally. Emissions from developing countries have a greater impact on temperature and precipitation over the tropical monsoon regions of China and India. Our results demonstrate the importance of trade and emission region in determining how consumption translates into global climate impact.

CO2 Emissions Hit Record High in 2021

by P. Homewood, Mar 9, 2022 in NotaLotofPeopleKnowThat


Energy-related CO2 emissions grew to
36.3 Gt in 2021, a record high


Global CO2 emissions from energy combustion and industrial processes1 rebounded in 2021 to reach their highest ever annual level. A 6% increase from 2020 pushed emissions to 36.3 gigatonnes (Gt), an estimate based on the IEA’s detailed region-by-region and fuel-by-fuel analysis, drawing on the latest official national data and publicly available energy, economic and weather data.

The Covid-19 pandemic had far-reaching impacts on energy demand in 2020, reducing global CO2emissions by 5.2%. However, the world has experienced an extremely rapid economic recovery since then, driven by unprecedented fiscal and monetary stimulus and a fast – although uneven – roll-out of vaccines. The recovery of energy demand in 2021 was compounded by adverse weather and energy market conditions, which led to more coal being burnt despite renewable power generation registering its largest ever annual growth. 

Emissions increased by almost 2.1 Gt from 2020 levels. This puts 2021 above 2010 as the largest ever year-on-year increase in energy-related CO2 emissions in absolute terms. The rebound in 2021 more than reversed the pandemic-induced decline in emissions of 1.9 Gt experienced in 2020. CO2 emissions in 2021 rose to around 180 megatonnes (Mt) above the pre-pandemic level of 2019.

The 6% increase in CO2 emissions in 2021 was in line with the jump in global economic output of 5.9%. This marks the strongest coupling of CO2 emissions with Gross domestic product (GDP) growth since 2010, when global emissions rebounded by 6.1% while economic output grew by 5.1% as the world emerged from the Global Financial Crisis.

New Study Suggests The Early Holocene’s Baltic Sea Temperatures Were 5-11°C Warmer Than Present

by Weiss et al., 2022 in NoTricksZone


Baltic Sea surface temperatures may have reached 24°C 7,200 years ago compared to the current 12.7°C.

A new study (Weiss et al., 2022) indicates Baltic Sea regional surface temperatures ranged between 21-24°C from ~5.7 to 7.7 ka (thousand years ago). This period is referred to as the Baltic’s Holocene Thermal Maximum.

Temperatures dipped to 17.2°C at 1.373 ka. (The time span ranging from 0.0 ka to 3 ka is referred to in the study as the Modern Baltic, or M.B.)

The current (0.0 ka) surface temperature for the Baltic S is 12.7°C. This temperature is more than 11°C colder than the Baltic’s temperatures at 7.2 ka.

German Paper: “A Mild Additional Temperature Rise Of Around 1°K”… Drop Not Excluded By 2100!

by P. Gosselin, Mar 6, 2022 in NoTricksZone


In its most recent video, German site Die kalte Sonne here looks at a paper on CO2 climate forcing by Stefani 2021: Solar and Anthropogenic Influences on Climate: Regression Analysis and Tentative Predictions. The results point to only a moderately warming planet up to the year 2150.

To hype up climate warming alarm, IPCC scientists like to exaggerate CO2’s power to trap heat and warm up the atmosphere. But with every assessment report that the IPCC issues, the estimated value by which CO2 warms the planet steadily gets reduced as the observed warming keeps lagging behind what earlier models predicted.

In his paper, Frank Stefani and his team at the Helmholtz Center, Institute of Fluid Dynamics in Dresden, Germany looked at the impacts by CO2 and solar activity.

On average 1.1°C warming

Using double regression, the scientists evaluated linear combinations of the logarithm of the carbon dioxide concentration and the geomagnetic aa index as a proxy for solar activity. They reproduced the sea surface temperature (HadSST) since the middle of the 19th and ended up with a a climate sensitivity (of TCR type) in the range of 0.6 K until 1.6 K per doubling of CO2. The midpoint of this range is 1.1°C, a value many critical climate scientists have already estimated earlier, and thus far below the IPCC scary estimates.

The paper’s abstract elaborates further:

The Pause Lengthens Again: No Global Warming for 7 Years 5 Months

by C. Monckton of Brenchley, Mar 4, 2022 in WUWT


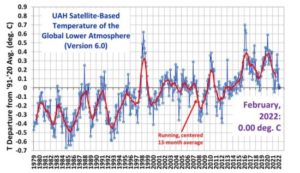
The drop from 0.03 K to 0.00 K from January to February 2022 in the UAH satellite monthly global mean lower-troposphere dataset has proven enough to lengthen the New Pause to 7 years 5 months, not that you will see this interesting fact anywhere in the Marxstream media

….

UAH Global Temperature Update for February 2022 Was 0.00 deg. C

by Roy Spencer, Mar 2, 2022 in ClimateChangeDispatch


The Version 6.0 global average lower tropospheric temperature (LT) anomaly for February 2022 was 0.00 deg. C, down a little from the January 2022 value of +0.03 deg. C.

The linear warming trend since January 1979 still stands at +0.13 C/decade (+0.12 C/decade over the global-averaged oceans, and +0.18 C/decade over global-averaged land).

Pielke Jr. on IPCC AR6 WG2 Release

by Pielke Jr., Feb28, 2022 in WUWT


An initial thread on the IPCC AR6 WG2 report released today

Whereas WG1 received a mixed review in my areas of expertise (specifically: poor on scenarios, solid on extremes), my initial reaction to the WG2 report is that it is an exceedingly poor assessment

The first observation is that the report is more heavily weighted to implausible scenarios than any previous IPCC assessment report

In particular, RCP8.5 represents ~57% of scenario mentions

This alone accounts for the apocalyptic tone and conclusions throughout the report.

How The Green Movement Empowered Putin’s Invasion Of Ukraine

by C. Feldman , Feb 2, 2022 in ClimateChageDispatch


Whatever you think our obligations to defend Ukraine at the moment, you must concede that the green movement in Western Europe and the United States made his actions possible. [bold, links added]

They also made any non-military reaction toothless and unpersuasive. It has been the equivalent of a poker player discarding a royal straight flush and then trying to bluff his opponents with the pair of deuces remaining in his hand.

Only with dumb opponents is he likely to take the pot. And Russian President Putin is definitely not dumb.

Indeed, the weak sanctions proposed by the West to induce the Russians to pull back were so unimpressive the Russian stock market, which has been collapsing, rose 6.5 percent after President Biden announced them.

Mr. Biden did follow Germany in not certifying Nord Stream 2, but that’s just a temporary, paper contract issue. It’s not a long-term or permanent shutdown. He basically hit a couple of banks tied to the Donbas region.

The GDP for the whole of Ukraine is about $160 billion, maybe. The GDP of Donbas is less than $6 billion and the GDP of Lugansk is $1 billion, also maybe. Delaware’s GDP, just to pick a random comparison, is $76 billion. So, to call Mr. Biden’s sanctions small beer is understating it.

And the reason he cannot actually do much more short of war is that he and the leaders of western Europe—bamboozled by the prospect of “climate change”—have made themselves poorer and weaker by eviscerating conventional fuel production.

While they without ample reason were discarding a very good hand, Russian president Putin was improving his by exploiting and selling to us and Europe his nations’ fossil fuels.

….

The green dream goes lethal

by Melanie Phillips, Feb 24, 2022


There are many reasons why the west must bear considerable responsibility for this crisis. As I wrote here, these include the fantasy indulged in until this week by western nations that Putin posed no threat and was instead a person through whom westerners could enrich themselves.

Thus Britain’s capital has been dubbed “Londongrad,” because British governments have allowed so many of Putin’s fellow oligarchs to use its infrastructure to launder stolen Russian funds — contributing in the process so much to Britain’s GDP.

Then there’s the European embrace of pacifism, which has led Britain and other European states to cut their defence spending and rely instead on America’s protective umbrella which they all took for granted.


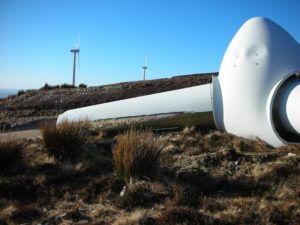
Storm damaged wind turbine, Ireland, 2008

That parasitic illusion went belly-up with the advent of the Biden administration, whose refusal to defend the free world and its preference instead to throw in the towel wherever possible  — as demonstrated most graphically by America’s disorderly scuttle from Afghanistan — has been duly noted by Putin, along with the regimes in China and Iran, as evidence that the Biden administration would take no effective action to counter their own aggression.

But even more shocking that all this is that, through their unhinged obsession with “climate change,” America, Britain and Europe have handed Putin his greatest weapon against them.

In their determination to reduce carbon emissions by turning against fossil fuels, and having put so many of their eggs in the basket of renewables which are desperately unreliable as national sources of energy, they have made themselves overly dependent on gas.

Sinking Sea Level Alarmism: Study By Nevada Scientists Show Surface Motion of Continents “On Average Upward”

by P. Gosselin, Feb 27, 2022 in NoTricksZone


German climate science critical site Die kalte Sonne here reports on a recent study by Hammond et al (2021) titled:  “GPS Imaging of Global Vertical Land Motion for Studies of Sea Level Rise“.