Dr. Fukai also points out that global vegetation coverage increased by 11% in 29 years, from 1982 to 2010, as increasing CO2 has helped the greening of the Sahel and Sahara Desert. He contradicts the often heard media claims that drought is spreading globally, writing: “The media spread the word that desertification is progressing globally, but practically the desert is greening through CO2.” […] “Everyone should be aware that increasing CO2 concentrations in atmosphere is not in itself harmful, but it’s a good thing.”
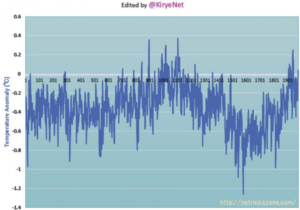
The retired Japanese professor writes that at around 1000 A.D. — the Medieval Warm Period — there were no signs showing CO2 concentration was higher. A temperature graph using data from Moberg et al. (2005) shows the Medieval Warm Period appears clearly and that CO2 was in fact around 280 ppm at that time.
This paper (.pdf 17 pages) reports the results of a detailed analysis carried out using published UK Met Office data up to 2017. These show:
UK temperatures rose during the 1990s and early 2000s. This rise is associated with a similar increase in near-coastal sea surface temperatures. There has been no rise in the last decade.
Seasonal temperatures have followed a similar pattern: a rise during the 1990s, but a levelling off since.
This sudden rise in UK land temperature is not unprecedented, with the Central Eng- land Temperature series (CET) showing a similar occurrence in the early 18th century.
Analysis of CET shows that despite the rise in average summer temperatures, there has been no increase in the highest daily temperatures, or the frequency of extreme high temperatures, in recent years. In fact the opposite is true. Heatwaves were far more intense in 1975 and 1976, when there were thirteen days over 30◦C. By contrast, between 2007 and 2017 there have only been two such days. (Note that there was also only been one day over 30◦C in the summer of 2018). The highest daily temperature on CET was 33.2◦C, set in 1976 and equalled in 1990.
Much of my rebuttal was put together from prior WUWT posts on this subject, there’s at least one new addition to the vast evidence of scientific division (Stenhouse et al., 2017).
Stenhouse et al., 2014 told us that atmospheric scientists are very divided on climate change over the past 150 years.
…
89% × 59% = 52%… A far cry from the oft claimed 97% consensus.
In a world riddled with climate-change doomsday predictions, a small but growing number of scientists are saying the highly touted climate models predicting steadily increasing global temperature due to humans’ carbon-dioxide emissions are wrong and that Earth could soon face something even direr: global cooling.
One such climate scientist is Valentina Zharkova, an astrophysicist at Northumbria University in the United Kingdom.
Zharkova and her team of researchers say that based on mathematical models of the Sun’s magnetic activity, it’s likely Earth will experience decreasing magnetic waves over a 33-year period beginning in 2021.
Abstract. Light absorbing aerosols in the atmosphere and cryosphere play an important role in the climate system. Their presence in ambient air and snow changes the radiative properties of these systems, thus contributing to increased atmospheric warming and snowmelt. High spatio-temporal variability of aerosol concentrations and a shortage of long-term observations contribute to large uncertainties in properly assigning the climate effects of aerosols through time.
Starting around AD1860, many glaciers in the European Alps began to retreat from their maximum mid-19th century terminus positions, thereby visualizing the end of the Little Ice Age in Europe. Radiative forcing by increasing deposition of industrial black carbon to snow has been suggested as the main driver of the abrupt glacier retreats in the Alps. The basis for this hypothesis was model simulations using elemental carbon concentrations at low temporal resolution from two ice cores in the Alps.
by A. Bright-Paul, October 22, 2018 in ClimateChageDispatch
As the Earth rotates on its own axis, one-half of the Earth is cooling while the other half is warming up.
So the Earth is warming and cooling daily and the temperature is changing 3,600 times every hour in every location all over the world, as there are 3,600 seconds in every hour.
As the Earth is traveling around the Sun in an ellipse at 66,000 miles per hour and is tilted and wobbling as it spins, so the Earth has seasons, as the angle to the Sun varies.
So the temperatures in the spring and summer are usually warmer than in the autumn and winter when temperatures decline.
So there is a massive number of different temperatures over the whole Earth, constantly changing and always in flux.
The fast approaching solar minimum and its potential impact on the upcoming winter season
By Meteorologist Paul Dorian
Overview
In the long term, the sun is the main driver of all weather and climate and multi-decadal trends in solar activity can have major impacts on oceanic and atmospheric temperatures. In addition, empirical observations have shown that the sun can have important ramifications on weather and climate on shorter time scales including those associated with the average solar cycle of around 11-years. For example, there is evidence that low solar activity during solar minimum years tend to be well-correlated with more frequent “high-latitude blocking” events compared to normal and this type of atmospheric phenomenon can play an important role in the winter season.
…
his plot shows the daily observations of the number of sunspots during the last four solar cycles back to 1 January 1977 according to Solar Influences Data Analysis Center (SIDC). The thin blue line indicates the daily sunspot number, while the dark blue line indicates the running annual average. The current low sunspot activity is indicated by the arrow at the lower right of the plot. Last day shown: 30 Sep 2018. Data source: climate4you.com.
The climate of the pre-industrial past is of greatest importance to the ongoing climate discussion. Current climate can only be understood when interpreting it in the paleoclimatological context of the past few thousand years. Until not too long ago it was thought that the pre-industrial climate was monotonous and constant. This idea was e.g. promoted by Mann et al. whose famous hockey stick curve featured prominently in the IPCC report of 2001. Over the last 15 years, however, a large number of studies changed this view by providing robust evidence for the existence of significant natural climate variability. Of particular interest are the past 1000 years which commenced with the generally warm ‘Medieval Climate Anomaly’ (MCA, aka ‘Medieval Warm Period’, MWP), that eventually passed into the ‘Little Ice Age’ (LIA), before returning to the warm climate of the current ‘Modern Warm Period’ of the 20th and early 21st centuries.
There have been controversial debates about the existence of the MWP, …
by Richard Lindzen, 21 octobre 2018, Conférence GWPF, in Skyfall
Traduction par Volauvent.
Il y a plus d’un demi-siècle, C.P. Snow (romancier et physicien anglais qui a également occupé plusieurs postes importants dans la fonction publique britannique et brièvement au sein du gouvernement britannique) a examiné de manière célèbre les implications de « deux cultures » :
Bien des fois, j’ai assisté à des rassemblements de personnes qui, selon les normes de la culture traditionnelle, sont considérées comme très éduquées et qui ont exprimé leur incrédulité face à l’analphabétisme des scientifiques. Une ou deux fois, j’ai été provoqué et j’ai demandé à la compagnie combien d’entre eux pourraient décrire la deuxième loi de la thermodynamique. Ils répondaient froidement : c’était aussi toujours négatif. Pourtant, je demandais quelque chose qui était l’équivalent scientifique de : avez-vous lu un ouvrage de Shakespeare ?
Je crois maintenant que si j’avais posé une question encore plus simple – telle que : que voulez-vous dire par masse ou accélération, qui est l’équivalent scientifique de : pouvez-vous lire ? – pas plus d’un diplômé sur dix aurait eu l’impression que je parlais la même langue que lui. Ainsi, le grand édifice de la physique moderne se construit, et la majorité des personnes les plus intelligentes du monde occidental en ont à peu près le même aperçu que leurs ancêtres néolithiques en auraient eu.
Je crains que peu de choses n’aient changé depuis l’évaluation de Snow, il y a 60 ans. Certains pourraient soutenir que l’ignorance de la physique n’a pas d’incidence sur la capacité politique, mais elle a très certainement une incidence sur la capacité des politiciens non scientifiques à traiter des problèmes théoriquement fondés sur la science. Le manque de compréhension est également une invitation à l’exploitation malveillante. Compte tenu de la nécessité démocratique pour les non-scientifiques de prendre position sur des problèmes scientifiques, la croyance et la foi remplacent inévitablement la compréhension, même si des récits simplifiés à outrance de façon triviale rassurent les non-scientifiques sur le fait qu’ils ne sont pas totalement dénués de « compréhension scientifique ». Le sujet du « réchauffement global » offre de nombreux exemples de tout cela.
Je voudrais commencer cette conférence par une tentative visant à forcer les scientifiques du public à se familiariser avec la nature réelle du système climatique et à aider les non-scientifiques motivés de ce public susceptibles de faire partie du groupe « Un sur dix » de Snow à aller au-delà des simplifications excessivement triviales.
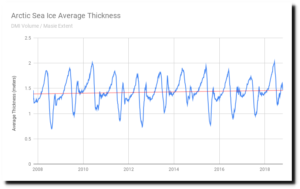
It is often claimed that modern day sea ice changes are “unprecedented”, alarming, and well outside the range of natural variability. Yet scientists are increasingly finding that biomarker proxies used to reconstruct both Arctic and Antarctic sea ice conditions since the Early Holocene reveal that today’s sea ice changes are not only not unusual, there is more extensive Arctic and Antarctic sea ice during recent decades than there has been for nearly all of the last 10,000 years.
Le 14 octobre dernier, durant une interview sur la chaine de télévision CBS, le président américain a exprimé à juste titre son scepticisme concernant le rôle de l’homme sur le changement climatique.
Contrairement à l’affirmation d’Al Gore daté du 12 octobre selon laquelle seuls « quelques rares marginaux » dans la communauté scientifique ne partageraient pas l’avis du GIEC, de nombreux chercheurs sont en désaccord avec les conclusions faites par l’agence internationale.
En effet, c’était un euphémisme pour le président américain de déclarer durant l’interview « qu’il y a des scientifiques qui réfutent cela », en parlant d’un lien entre la fonte de glace au Groenlandet du changement climatique anthropique.
Le 8 octobre dernier, durant sa conférence devant la Global Warming Policy Foundation (GWPF) située à Londres, le professeur Richard Lindzen a mentionné « la découverte faite conjointement par la NOAA (la National Oceanic and Atmospheric Administration) et l’Institut Météorologique Danois, à savoir que la masse de glace du Groenland a effectivement augmenté ».
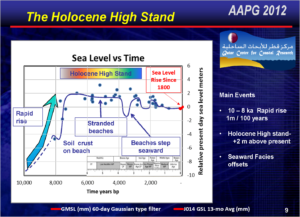
I didn’t take the time to look up the dates of these World Heritage sites… But I’m going to guess they’re OLD. Many of them probably date back to the Early to Mid-Holocene. [My bad… That was a bad guess. The Late Holocene (Meghalayan Age) begins in 4200 BP (2250 BC)] Here’s a Holocene sea level reconstruction for the Arabian Gulf, with a recent reconstruction of global sea level since 1800 (Jevrejeva et al., 2014) and the satellite sea level trend from CU…
This post provides updates of the values for the three primary suppliers of global land+ocean surface temperature reconstructions—GISS through September 2018 and HADCRUT4 and NOAA NCEI (formerly NOAA NCDC) through August 2018—and of the two suppliers of satellite-based lower troposphere temperature composites (RSS and UAH) through September 2018. It also includes a few model-data comparisons.
This is simply an update, but it includes a good amount of background information for those new to the datasets. Because it is an update, there is no overview or summary for this post. There are, however, simple monthly summaries for the individual datasets. So for those familiar with the datasets, simply fast-forward to the graphs and read the summaries under the headings of “Update”.
In case you hadn’t heard we’re all doomed, yet the world mostly yawned. This is less complacency than creeping scientific and political realism.
The U.N. panel says the apocalypse is nigh—literally. According to its calculations, global carbon emissions must fall 45% by 2030—twice as much as its earlier forecasts—and the world must wean itself entirely off fossil fuels over three decades to prevent a climate catastrophe that will include underwater coastlines and widespread drought and disease.
These reductions are “possible within the laws of chemistry and physics,” said the report’s co-author Jim Skea, and that’s a relief. But he added: “Doing so would require unprecedented changes,” and the report said some methods “are at different stages of development and some are more conceptual than others, as they have not been tested at scale.”
The latest IPCC report was a setup – a cynical ploy to produce alarmist media headlines that succeeded beautifully.
Seven days ago the Intergovernmental Panel on Climate Change (IPCC) issued a press release along with a summary of its new Special Report on Global Warming of 1.5°C.
by Cédric Moro, 15 octobre 2018 in MythesMancies&Mathématiques
Les discours alarmistes sur le climat ne datent pas d’hier. Grâce à la numérisation des archives audio-visuelles et à leur mise en ligne sur internet, il est possible aujourd’hui de démentir les prévisions climato-catastrophistes assénées de manière très officielle dans la deuxième moitié du siècle dernier. Beaucoup des déformations de nos discours sur la réalité tendent à puiser leurs racines dans nos représentations mentales du monde. Nous verrons donc que ces représentations alarmistes naissent dans un contexte idéologique nouveau : mutation de l’eugénisme, collapsologisme et décroissance.
The recently released IPCC SR15 reports (at A1) that global warming is likely to reach 1.5°C between 2032 and 2050 and (at B) will probably bring species extinction, weather extremes and risks to food supply, health and economic growth. If we are to avoid this, net CO2 emissions will need to decline by about 45% from 2010 levels by 2030, reaching net zero by 2050 (C1), followed by extensive removals (C5). The required energy investment alone will be $2.4 trillion per year.
Is this possible?
As at 2015, which was not materially different from 2010, more than half the planet’s total CO2 emissions (36Gt) were sourced from just three countries:
A new paper documents “remarkably different” land temperatures from one instrumental data set to another. In some regions there is as much as an 0.8°C conflict in recorded temperature anomalies for CRU, NASA, BEST, and NOAA. The relative temperature trend differences can reach 90% when comparing instrumental records. Consequently, the uncertainty in instrumental temperature trends — “0.097–0.305°C per decade for recent decades (i.e., 1981–2017)” — is as large or larger than the alleged overall warming trend itself for this period.
Sediment cores from Western Lake provide a 7000-yr record of coastal environmental changes and catastrophic hurricane landfalls along the Gulf Coast of the Florida Panhandle. Using Hurricane Opal as a modern analog, we infer that overwash sand layers occurring near the center of the lake were caused by catastrophic hurricanes of category 4 or 5 intensity. Few catastrophic hurricanes struck the Western Lake area during two quiescent periods 3400–5000 and 0–1000 14C yr B.P. The landfall probabilities increased dramatically to ca. 0.5% per yr during an “hyperactive” period from 1000–3400 14C yr B.P., especially in the first millennium A.D. The millennial-scale variability in catastrophic hurricane landfalls along the Gulf Coast is probably controlled by shifts in the position of the jet stream and the Bermuda High.
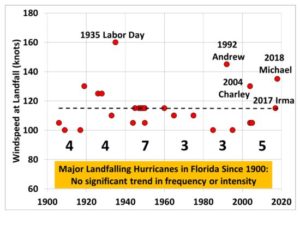
I’ve updated a plot of Florida major hurricane strikes since 1900 with Hurricane Michael, and the result is that there is still no trend in either intensity or frequency of strikes over the last 118 years:
The significance of course is that the warming of the oceans began long before any impact from CO2 emissions.
HH Lamb has written extensively about how sea temperatures in the Atlantic fell radically during the LIA. Is the warming trend since then merely a return to earlier conditions?
Steve McIntyre has a look at the “revised” PAGES2K temperature proxy dataset that includes tree rings and river sediments. He finds the usual ridiculous problems from the past, such as upside down data and river sediment accumulations that have more to do with building a dam than climate.
The following description of the climate system contains nothing that is in the least controversial, and I expect that anyone with a scientific background will readily follow the description. I will also try, despite Snow’s observations, to make the description intelligible to the non-scientist.
…
…
Conclusion
So there you have it. An implausible conjecture backed by false evidence and repeated incessantly has become politically correct ‘knowledge,’ and is used to promote the overturn of industrial civilization. What we will be leaving our grandchildren is not a planet damaged by industrial progress, but a record of unfathomable silliness as well as a landscape degraded by rusting wind farms and decaying solar panel arrays. False claims about 97% agreement will not spare us, but the willingness of scientists to keep mum is likely to much reduce trust in and support for science. Perhaps this won’t be such a bad thing after all – certainly as concerns ‘official’ science.
There is at least one positive aspect to the present situation. None of the proposed policies will have much impact on greenhouse gases. Thus we will continue to benefit from the one thing that can be clearly attributed to elevated carbon dioxide: namely, its effective role as a plant fertilizer, and reducer of the drought vulnerability of plants. Meanwhile, the IPCC is claiming that we need to prevent another 0.5◦C of warming, although the 1◦C that has occurred so far has been accompanied by the greatest increase in human welfare in history. As we used to say in my childhood home of the Bronx: ‘Go figure’.
Media Matters scrutinized the top 50 U.S. newspapers between 9 AM and noon ET on Monday and found most did not mention on their website homepages the Intergovernmental Panel on Climate Change’s Sunday release of its report on the devastating impacts of a global temperature increase of 1.5-degree Celsius (2.7-degree Fahrenheit) above the temperature of the pre-industrial era.
…
La géologie, une science plus que passionnante … et diverse