Archives de catégorie : better to know…?

A Potted History of Glaciers

by P. Homewood, Nov 10, 2021 in NotaLotofPeopleKnowThat


A friend recently suggested that “melting glaciers” must surely prove “global warming is true”.

It is a common belief. After all, glaciers are a visible phenomenon and it all sounds logical.

As you know, I have written extensively about glaciers, (see the “glaciers” tab on the sidebar). But it is worth posting this potted history of them:

Summary

The modern day retreat of glaciers is part of a much longer natural cycle. Indeed, we find evidence of that cycle going back long before the Middle Ages.

Lamb, for instance, claims that glaciers in the Alps and Norway were advancing between 800 and 400BC, reaching an extent almost as great as during the Little Ice Age. They advanced again around AD600 to a similar position as before.

In between times, of course, the same glaciers also retreated, both during the Roman Warm Period and the Medieval Warming Period.

Whether man-made warming has played any part in modern glacial retreat, we know that:

  • Most of the retreat since the 18thC occurred before any possible impact from humans.
  • Glaciers were smaller than now in the Middle Ages
  • There is nothing unprecedented or alarming about the current state of the world’s glaciers

All of this is common knowledge amongst glaciologists. But for some reason the world of climate science does not want the public to know.

China’s Climate Goals Hinge on a $440 Billion Nuclear Buildout

by D. Murtaugh & K. Chia, Nov 2, 2021 in BloombergGreen


China is planning at least 150 new reactors in the next 15 years, more than the rest of the world has built in the past 35.

Nuclear power once seemed like the world’s best hope for a carbon-neutral future. After decades of cost-overruns, public protests and disasters elsewhere, China has emerged as the world’s last great believer, with plans to generate an eye-popping amount of nuclear energy, quickly and at relatively low cost.

China has over the course of the year revealed the extensive scope of its plans for nuclear, an ambition with new resonance given the global energy crisis and the calls for action coming out of the COP26 Climate Summit in Glasgow. The world’s biggest emitter, China’s planning at least 150 new reactors in the next 15 years, more than the rest of the world has built in the past 35. The effort could cost as much as $440 billion; as early as the middle of this decade, the country will surpass the U.S. as the world’s largest generator of nuclear power.

Presidents Xi and Putin (and the Hedge Funds!) are laughing at us

by P. Homewood, Nov 8, 2021 in NotaLotofPeople KnowThat


The gap between rhetoric and fact is a perennial feature of politics. But seldom can the chasm between claim and reality have been as wide as that displayed by Alok Sharma at the Cop26 conference in Glasgow. The British president of the latest intergovernmental climate change gathering told the delegates (and the world’s media) that “the end of coal is in sight”, as a result of the agreement he had negotiated.


That was the rhetoric. Now the fact. Not only was the declaration to phase out coal by the 2040s not signed by the world’s top three consumers (China, India and America, which account for more than 70 per cent of the global CO2 emissions from burning the stuff); the pledge itself was neutered by the addition of the get-out “or as soon as possible thereafter”.

Climate change is no catastrophe

by M. Shellenberger, Nov 3, 2021 in Unherd


No global problem has ever been more exaggerated than climate change. As it has gone from being an obscure scientific question to a theme in popular culture, we’ve lost all sense of perspective.

Here are the facts: in Europe, emissions in 2020 were 26% below 1990 levels. In the United States, emissions in 2020 were 22% below 2005 levels. Emissions are likely to start declining, too, in developing nations, including China and India, within the next decade. Most nations’ emissions will be bigger this year than last, due to post-Covid economic growth. But global emissions are still likely to peak within the next decade.

And the result will be a much smaller increase in global average temperatures than almost anyone predicted just five years ago. The best science now predicts that temperatures are likely to rise just 2.5-3°Cabove pre-industrial levels. It’s not ideal, but it’s a far cry from the hysterical and apocalyptic predictions of 6°C, made just a decade ago. A 3°C increase is hardly an existential threat to humanity.

Not that you’d know it, if you had half an eye on the headlines this summer. The floods, fires and heatwaves that plagued the world were, for many observers, proof that the impacts of climate change have already become catastrophic. In Europe, more than 150 people died in flooding. In the United States, wildfire season started earlier and lasted longer, razing hundreds of thousands of acres. Around the world, hundreds died from heatwaves.

But again, it’s worth reminding ourselves of the facts: there has been a 92% decline in the per decade death toll from natural disasters since its peak in the 1920s. In that decade, 5.4 million people died from natural disasters. In the 2010s, just 0.4 million did. Globally, the five-year period ending in 2020 had the fewest natural disaster deaths of any five-year period since 1900. And this decline occurred during a period when the global population nearly quadrupled — and temperatures rose more than 1°C degree centigrade above pre-industrial levels.

A Theory of the Hack

by S. McIntyre, Nov 1, 2021 in ClimateAudit


Two major new BBC programs, The Trick and the Hack That Changed The World, re-visit 2009 Climategate events on the eve of UK hosting the most recent international climate get-together. I was interviewed by The Hack and mentioned in The Trick as a villain.

In today’s article, I’m going to propose a theory of the Climategate hack that is very different from the grandiose conspiracy of Russian intel services and US fossil fuel corporations that is the prevalent fantasy of the climate “community” and chattering classes. Subsequent to my interview with the Hack That Changed, I’ve re-examined and cross-checked documents and noticed some interesting new connections. I don’t know the identity of the Climategate hacker, but do believe that deductions about his profile (e.g. motivated individual vs paid institutional hacker) can be made more intelligently by carefully examining details of what was exfiltrated and when – as I shall do here.


‘Guess the climate rules don’t apply to them’

by P. Homewood, Nov 2, 2021 in NotaLotofPeopleKnowThat


Bill Gates and Jeff Bezos were slammed as hypocrites for lecturing the world on the need to combat climate change by reducing carbon footprint while at the same time reportedly vacationing on superyachts off the coast of Turkey.

Multi-billionaire and Microsoft founder Gates celebrated his 66th birthday in Turkey in the company of fellow tycoon and Amazon founder Bezos on Friday.

Bezos was among the 50 guests invited to Gates’ private party beside the Mediterranean. It’s not clear whether any of Gates’ family helped him celebrate at his exclusive bash.

Gates – once the richest man on earth who has dropped to fourth on the Forbes Rich List ranking with $124 billion – transported his guests by helicopter from his $2million-a-week rental yacht ‘Lana’ to the Sea Me Beach club in Fethiye.

The jet fuel used to power helicopters emits 21.095 pounds of carbon dioxide per gallon burned, and helicopters travel approximately 10.75 miles per gallon.

According to reports, Bezos also travelled to Gates’ superyacht by helicopter.

The Blue Origin founder is said to have made the 120-mile round trip journey by chopper from Govoka to the resort town of Fethiye.

Based on the same estimations, Bezos’ helicopter emitted some 215 pounds of carbon dioxide into the atmosphere.

Both Bezos and Gates are reportedly staying on superyachts – each of which emits 7,020 tons of carbon dioxide per year, or 19 tons per day.

The Decline, the Stick and The Trick – Part 1uydi

by S. McIntyre, Nov 2, 2021 in ClimateAudit


One of the central claims of The Trick, if not the most central claim, was that “hiding the decline” was nothing more than an inopportune phrase about a single diagram.

It wasn’t.

The “trick to hide the decline” was an inopportune, if revealing, phrase, but rather than the issue being limited to a single diagram, the inconsistency between the Decline (in observed tree ring widths and densities) and the Hockey Stick temperature reconstructions (primarily based on tree ring widths) was, together with the looting of the Baghdad Museum, the issue that inspired my original examination of Michael Mann’s Hockey Stick and was the driving theme of Climate Audit from its origin up to Climategate.  There are dozens, even hundreds, of Climate Audit articles that, in one way or another, relate back to the conundrum arising from the inconsistency of the underlying proxies and the superficial consistency of the reconstructions.

In this and a couple of follow-on articles, I’ll illustrate the centrality of The Decline vs The Stick in the controversies in the years prior to Climategate.  For the benefit of people that may be new to these disputes, I re-iterate that I never interpreted the late 20th century decline in ring widths as evidence of a decline in temperatures, but as a seriously problematic inconsistency for “reconstructions” relying in large part on tree rings.

April 2003

When I say that the Decline inspired my original examination of Michael Mann’s Stick, it is literally true.

I had become mildly interested in climate issues in late 2002 when the Canadian government was promoting the Kyoto treaty, including in its promotion the assertion that 1998 was the “warmest year” in 1000 years.  This was based on the 2001 IPCC Assessment Report, which included multiple versions of the Hockey Stick graph, one of which was the following:

The Climate Is Changing, And Human Activities Are The Cause”: How, Exactly, Do We Know That?

by F. Menton, Oct 28, 2021 in WUWT


“The climate is changing, and we are the cause.” That is a statement that is so often-repeated and affirmed that it goes way beyond mere conventional wisdom. Probably, you encounter some version or another of that statement multiple times per week; maybe dozens of times. Everybody knows that it is true! And to express disagreement with that statement, probably more so than with any other element of current progressive orthodoxy, is a sure way to get yourself labeled a “science denier,” fired from an academic job, or even banished from the internet.

The UN IPCC’s recent Sixth Assessment Report on the climate is chock full of one version after another of the iconic statement, in each instance of course emphasizing that the human-caused climate changes are deleterious and even catastrophic. Examples:

  • Human influence has likely increased the chance of compound extreme events since the 1950s. This includes increases in the frequency of concurrent heatwaves and droughts on the global scale (high confidence); fire weather in some regions of all inhabited continents (medium confidence); and compound flooding in some locations (medium confidence). (Page A.3.5)
  • Event attribution studies and physical understanding indicate that human-induced climate change increases heavy precipitation associated with tropical cyclones (high confidence) but data limitations inhibit clear detection of past trends on the global scale. (Page A.3.4, Box TS.10)
  • Some recent hot extreme events would have been extremely unlikely to occur without human influence on the climate system. (Page A.3.4, Box TX.10)

So, over and over, it’s that we have “high confidence” that human influence is the cause, or that events would have been “extremely unlikely” without human influence. But how, really, do we know that? What is the proof?

This seems to me to be rather an important question. After all, various world leaders are proposing to spend some tens or hundreds of trillions of dollars to undo what are viewed as the most important human influences on the climate (use of fossil fuels). Billions of people are to be kept in, or cast into, energy poverty to appease the climate change gods. Political leaders from every country in the world are about to convene in Scotland to agree to a set of mandates that will transform most everyone’s life. You would think that nobody would even start down this road without definitive proof that we know the cause of the problem and that the proposed solutions are sure to work.

If you address my question — what is the proof? — to the UN, they seem at first glance to have an answer. Their answer is “detection and attribution studies.” These are “scientific” papers that purport to look at evidence and come to the conclusion that the events under examination, whether temperature rise, hurricanes, tornadoes, heat waves, or whatever, have been determined to be “attributed” to human influences. But the reason I put the word “scientific” in quotes is that just because a particular paper appears in a “scientific” journal does not mean that it has followed the scientific method.

The UN IPCC’s latest report, known as “Assessment Report 6” or “AR6,” came out in early August, loaded up, as already noted, with one statement after another about “high confidence” in attribution of climate changes and disasters to human influences. In the couple of months since, a few statisticians who actually know what they are doing have responded. On August 10, right on the heels of the IPCC, Ross McKitrick — an economist and statistician at the University of Guelph in Canada — came out with a paper in Climate Dynamics titled “Checking for model consistency in optimal fingerprinting: a comment.” On October 22, the Global Warming Policy Foundation then published two Reports on the same topic, the first by McKitrick titled “Suboptimal Fingerprinting?”, and the second by statistician William Briggs titled “How the IPCC Sees What Isn’t There.” (Full disclosure: I am on the Board of the American affiliate of the GWPF.).

Cooked Up Consensus: Lynas et al “Should Rather Be Classified As Propaganda, Bad Science”…”Truly Brazen”

by P. Gosselin, Oct 26, 2021 in NoTricksZone


Martin Landvoigt writes on truth and consensus, climate models, the “fundamental and methodological difficulties” in climate science and how “hard, robust evidence is largely lacking” and so it’s “a matter of weakly substantiated opinions”.

Climate consensus and the climate

By Martin Landvoigt at Philosophieren für alle), Die kalte Sonne
(Text excerpt translated, subtitles added by P. Gosselin)

On this basis, the argument of the supposed consensus in climate science has been presented several times and repeatedly.

Numerous studies are supposed to prove this. In particular, the study: Quantifying the consensus on anthropogenic global warming in the scientific literature – John Cook, Dana Nuccitelli, Sarah A Green, Mark Richardson, Bärbel Winkler, Rob Painting, Robert Way, Peter Jacobs and Andrew Skuce – Published 15 May 2013.

Cook et al 2013 refuted

Arguably the most influential study used by U.S. presidents and other top-level decision makers as evidence for climate policy. Nevertheless, it can be considered refuted:

No signs of a climate emergency for W. Hudson Bay polar bears this year ahead of UN climate meeting

by  S. Crockford’s Polar Bear Science, Oct 17, 2021 in WUWT


Reposted from Dr. Susan Crockford’s Polar Bear Science

By Susan Crockford,

Posted on October 15, 2021 | Comments Offon No signs of a climate emergency for W. Hudson Bay polar bears this year ahead of UN climate meeting

I’ve been told that another complete aerial survey of the Western Hudson Bay polar bear subpopulation (from the Nunavut to Ontario boundaries) was conducted in August this year and that the bears have been hanging out further south than usual. It will be years before the results of the population count are published, of course (especially if it’s good news) but my contacts also say virtually all of the bears are in great condition again this year.

This is significant because W. Hudson Bay bears are one of the most southern subpopulations in the Arctic (only Southern HB bears live further south) and older data from this region is being used to predict the future for the entire global population based on implausible model projections (Molnar et al. 2020). And scary predictions of future polar bear survival are often taken to be proxies for future human disasters (see ‘Polar bears live on the edge of the climate change crisis‘), a point that some activists will no doubt make in the coming weeks, as the long-awaited UN climate change bash #26 (COP26) gets underway in Glasgow, Scotland on October 31.

September Mean Temps In Northern Europe See Little Change Over Past Decades…Snow, Frost Arrive

by P. Gosselin, Oct 17, 2021 in NoTricksZone


Today we look at September mean temperatures at the stations across northern Europe for which the Japan Meteorological Agency (JMA) have enough data. We find fall is not being pushed back as we should expect in a warming world.

The JMA has published the data for September and again we see a continuing warming hiatus.

First we look at the September trends from 6 stations in Ireland since 1991:


Urban areas more likely to have precipitation-triggered landslides, exposing growing populations to slide hazards

by American Geophysical Union, Oct 12, 2021 in ScienceDaily


Urban areas may be at greater risk for precipitation-triggered landslides than rural areas, according to a new study that could help improve landslide predictions and hazard and risk assessments.

Landslides cause thousands of deaths and billions of dollars of damage annually. With over half of the world’s population in urban areas, and both urbanization and precipitation extremes expected to increase in the future, understanding how urban landscapes are affected by precipitation-triggered landslides is a pressing need.

The new study used a large database of precipitation-triggered landslides across the Pacific coast of the U.S. and isolated the influence of precipitation changes using a specific type of computer model. When the researchers controlled for other factors, like slope steepness, rock type, and wildfire, they found that urban landslide hazard was up to 10 times more sensitive to variations in precipitation than in rural areas. That means that the same increase in rainfall in rural and urban areas could be 10 times more likely to cause a landslide in a city.

The new research is published in the AGU journal Geophysical Research Letters, which publishes high-impact, short-format reports with immediate implications spanning all Earth and space sciences.

Where Have All The Disasters Gone?

by W. Essenbach, Oct 14, 2021 in WUWT


I read today that the EU is using an estimate of US$68 per tonne of CO2 emissions for the purported cost of the damages done by CO2. This is known by a Newspeak term as the “Social Cost Of Carbon”.

It made me wonder—using this estimate, what is the overall total estimated damage done by humans from emitting CO2?

The answer is $97 TRILLION dollars since 1950.

YIKES! That’s about five times the 2020 US Gross Domestic Product (the value of everything produced in the US during that year).

So I thought I’d take a look at the various largest weather-related disasters. I got the big-disaster data from Wikipedia here and arranged it by type of disaster. All values are in 2020 dollars, that is to say, they’re adjusted for inflation. Here is the result.

Aussie Met Bureau – making up 13 years of missing temperature data

by D. Mason-Jones, Oct 15, 2021 in WUWT


Upon finding a 13-year gap in its data for an important weather station in Queensland, the Australian Bureau of Meteorology homogenised data from 10 other locations to fill-in the missing years. One of these places was more than 400km away and another almost 2.5 degrees of latitude further South.

Is the resulting data credible? No, is the conclusion reached in a research Report by Australian scientist, Dr. Bill Johnston.

When the US Army Air Force (USAAF) closed its heavy bomber transit base at Charleville at the end of the Second World War the aerodrome reverted to civilian status. The base had been a link in the ferry route delivering aircraft from factories in the US to the war zone.


4 More New Reconstructions Affirm The Medieval Warm Period Was ‘Warmer Than Today’

by K. Richard, Oct 14, 2021 in NoTricksZone


From Russia to the Indian Ocean to Antarctica, surface temperatures were much warmer than  they are today during Medieval times.

1. The Eastern Russia region was 1.5°C warmer than now during the Medieval Warm Period. The modern warm-up began centuries ago and temperatures have declined in the last few centuries. Relative sea levels were 1 m higher than now 1,000 years ago.

Nazarova et al., 2021

….


2. Scientists use coral fossil evidence to suggest mean sea surface temperatures (SST) during the Medieval Climate Anomaly were “warmer than today”. At the two Indian Ocean study sites, there has been no obvious SST warming since 1982.

Yudawati Cahyarini et al., 2021

3. The modern (1994-2004) surface temperatures in the South China Sea are colder now than any time in the last 6000 years. Except for a brief interval ~500 years ago, SSTs have been consistently 2-4°C warmer than today since the middle Holocene.

Zhou et al., 2021

….

4. Modern sea ice extent for Antarctica’s Ross Sea is more extensive today (and temperatures cooler) than nearly any time in 6000 years.  It was warmer with less sea ice 1.6 to 0.7k years ago. Penguin numbers decline with cooling/increased sea ice.

Xu et al., 2021

“Climate Emergency” – Nothing But Politics And Propaganda Unsupported By Scientific Data

by  L. Hamlin, Oct 6, 2021 in WUWT


The “climate emergency” claim hyped by Scientific American and other political climate alarmist entities is based on the completely fallacious statement that “the planet is heating up way to fast” with that flawed claim representing nothing but politics and propaganda that is disproved by actually measured global temperature anomaly temperature measurements between 1988 and 2021 as well as being directly contradicted by the more than 5 year-long declining global temperature anomaly data presented by all 5 major global temperature anomaly measurement systems between 2016 and 2021.

SHARP UPTICK IN ARCTIC SEA ICE: EXTENT ON COURSE TO BE THE HIGHEST IN 15 YEARS

by Cap Allon, Aug 28, 2021 in Electroverse


Arctic Sea Ice Extent has been holding exceptionally well during the 2021 summer melt season.

Throughout August, higher volumes than usual have survived due to cold conditions and favorable wind patterns.

As a result, Arctic Sea Ice Extent is now the highest in 8 years, and, if this year’s trajectory continues for another week or two (which is expected), 2021 will achieve the ‘healthiest’ extent of the past 15 years (since 2006).

Only 2014, 2013, and 2009 remain in its way–though the gap is narrowing, fast:

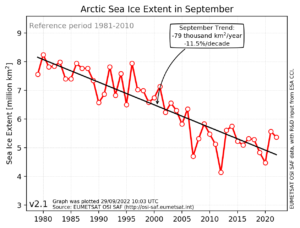
Stalled: September Arctic Sea Remains Surprisingly Stable Over Past Decade, “Long Way From Predicted “Ice Free”

by P. Gosselin, Sept 10, 2021 in NoTricksZone


This year’s Arctic sea ice minimum reaches third highest level in a decade, latest data show.

Die kalte Sonne here presents its latest climate video. The first part looks at this year’s Arctic sea ice melt season. Now that it’s September, sea ice extent has just about reached its minimum for the year and soon the annual refreeze will begin.

We recall that years ago alarmist scientists and wacko activists, like al Gore, predicted an ice free Arctic by now. Today we look at the most recent data and we see that we are a very long way from that point.

Very slow August melt this year

What follows is the chart from the National Snow and Ice Data Center (NSIDC):

Countdown to COP26 on the road to failure

by D. Wojick, Sept 7, 2021 in Fact 


It is less than 60 days until COP26 convenes in Glasgow. We can expect a flood of climate horror stories (including flooding). But there will also be some discussion of the actual issues, so here is a brief breakdown of the big four.

Keep in mind that the alarmists have a bit of a civil war going on, between what I call the moderates and the radicals. The moderates have been at it for over 30 years and the radicals are fed up. The moderates now have a net zero target of 2050, while the radicals want 2030, so the difference is pretty stark. The last two COPs were partly paralyzed by this split, especially COP25. This fight will be a major factor in Glasgow.

The first two big issues are old business, money business to be precise. Of course it is all about money but these two are that by name — trading and finance.

Trading

The first big money issue is finalizing and launching the emissions trading scheme. This is part of the so-called Paris rule book, which was supposed to be settled well before now. The developed countries are depending on buying emission indulgences, which the developing countries dearly want to sell to them. This is the “net” in net zero.

Also some countries have indulgences left over from the now ended Kyoto trading. They want to bring these forward to be included in the new scheme. Some moderates oppose this.

The real problem is the radicals despise emission trading. They want every country to eliminate its own emissions, at home. Thus their target is actually more like gross zero, although some might allow domestic offsets. That issue has yet to really arise, but the trading fight froze COP25.

Finance

Lithium: How the Taliban will fight climate change?

by D.Middleton, Aug 24, 21, 2021 in WUWT


Afghanistan is the “the Saudi Arabia of lithium” –a metal that is essential for electric vehicle batteries and battery storage technologies. According to the International Energy Agency these technologies account for 30 percent of the current global demand for lithium. Demand for lithium is projected to increase 40-fold above 2020 levels by 2040, along with rare earth elements, copper, cobalt, and other minerals in which Afghanistan is also naturally rich.

China currently controls the supply chains for most of the production and/or processing of these minerals. Now China may have another source.

ANTARCTIC SEA ICE ‘REBOUND’ SURPRISES SCIENTISTS — MSM SILENT

by Cap Allon, Aug 25, 2021 in Electroverse


Just two years ago, many mainstream media outlets declared that sea ice at the South Pole was melting at an “astonishing” rate.

As recently pointed out by notrickszone.com, German national daily Süddeutsche Zeitung reported in June 2019 that Antarctic sea ice had “shrunk 1.8 million square kilometers”, writing: “the massive disappearance of ice is astonishing”.

And while the reporting was technically factual, it has proven to be yet more AGW-driving obfuscation and cherry-picking rather than well-founded indications of a concerning climatic trend.

And now, in 2021, as the ice sharply rebounds, these same MSM outlets have fallen silent–which is speaking volumes…


Sea ice at the South Pole has rebounded in 2020 and 2021, to the levels of some 3-decades ago.

Moreover, the trend of the past 40+ years (the satellite era) remains one of significant growth (of approx 1% per decade).

In 2021, Antarctic sea ice is actually tracking well-above the multidecadal average (shown below).

MASSIVE SEA ICE REBOUND GOES UNREPORTED

The climate-ambulance chasing MSM have stopped reporting on the state of the ice across the Southern Hemisphere.

CLASSIC DISINFORMATION TECHNIQUE

“Researchers are in agreement that the decline in Antarctic sea ice from 2016 to 2019 is due to natural causes,” writes Die kalte Sonne. “Obviously this is not a good topic for the Süddeutsche Zeitung, who prefer not to report on the ice recovery.”

Not informing the public about the most recent developments, but instead leaving them with a false impression based on carefully cherry-picked data from two years prior, is a classic disinformation technique that has long been perfected by the activist media.

For more on Antarctica, see:

New Study: 2000-Year Precipitation Reconstructions Expose Climate Models Still Of Junk Grade

by Atwood et al., Aug 18, 2021 in NoTricksZone


A new study by Atwood et al (2021) published in the journal of Paleoceanography and Paleoclimatology found there’s “poor agreement” between precipitation reconstructions and model simulations over the past 2000 years. This means future projections made by current models are unreliable. 


Models and reconstructions don’t agree

These comprehensive reconstructions show that from 800 to 1000 CE there was a pronounced drying event relative from the eastern Pacific and parts of Mesoamerica.

Also the period “1400–1700 CE is marked by pronounced hydroclimate changes across the tropics, including dry and/or isotopically enriched conditions in South and East Asia, wet and/or isotopically depleted conditions in the central Andes and southern Amazon in South America, and fresher and/or isotopically depleted conditions in the Maritime Continent.”

The study’s abstract also notes how there’s a glaring disagreement between the simulations done by models and what the reconstructions show: “We find notable dissimilarities between the regional hydroclimate changes and global-scale and hemispheric-scale temperature reconstructions, indicating that more work needs to be done to understand the mechanisms of the widespread tropical hydroclimate changes during the LIA.”

Antarctic Sea Ice Recovery Surprises Scientists… Classic Disinformation Technique Of Not Reporting

by P. Gosselin, Aug 15, 2021 in NoTricksZone


Just two years ago, many of Germany’s mainstream media outlets declared sea ice at the South Pole was melting at an “astonishing” rate. For example, the left of center, Munich based Süddeutsche Zeitung,

German national daily Süddeutsche Zeitung (above) reported in June, 2019, that Antarctic sea ice had “shrunk 1.8 million square kilometers”, writing: “the massive disappearance of ice is astonishing”.

But many readers here, who are aware of the real data, know nothing of the sort over the long term has happened since satellite measurements began over 40 years ago.

Massive sea ice rebound goes unreported

Today, two years later, German climate science site Die kalte Sonne looks at recent sea ice developments in Antarctica – noting that the climate-ambulance chasing mainstream media like the Süddeutsche Zeitung have since mysteriously stopped reporting on Antarctica. Here’s why:

La cerise catastrophiste du GIEC

by ScienceClimatEnergie, 13 août 2021


Il fallait faire fort et ils l’ont fait : la toute première figure du résumé pour décideurs (SPM) du dernier rapport du GIEC (l’AR6), reproduite ci-dessous (Figure 1), est une véritable cerise sur leur gâteau catastrophiste. La courbe est destinée à faire peur au public, par exemple aux étudiants qui ne connaissent rien (ou très peu) de la science climatique (démonstration ici) et qui ont déjà décidé de faire grève en début d’année scolaire. Elle est également destinée aux décideurs trop occupés à leurs affaires politiques pour pouvoir se permettre d’analyser la courbe en profondeur. N’oubliez pas que le Royaume-Uni accueillera la 26eConférence des Parties des Nations unies sur le changement climatique (COP26) à Glasgow du 1er au 12 novembre 2021. Le SPM tombe donc à pic pour influencer les décideurs qui devront voter.

….

Conclusions

En comparant des pommes et des poires (raison n°1), en effaçant des chapitres entiers des livres d’histoire (raison n°2) et en jouant sur l’échelle du graphique (raison n°3), la Figure SPM.1 du GIEC remplit parfaitement son rôle : faire peur aux gens qui ne prennent pas le temps de réfléchir. Et cela marche, les manifestations ne font que commencer. Bravo le GIEC!

Mais ce super tour de passe-passe, ne suggère-t-il pas que le GIEC a perdu les pédales, est à bout de souffle et ne sait plus quoi inventer pour sortir de l’impasse? S’agirait-il d’une première forme de ‘suicide scientifique’? Espérons quand même que de nombreux scientifiques ne seront pas dupes, sinon il y a vraiment de quoi désespérer.

The UN IPCC buries two millennia of fluctuating temperatures

by P. Homewood, Aug 16, 2021 in NotaLotofPeopleKnowThat


….

That there has been 1.1°C of warming since 1850 is not especially controversial.  There is some disagreement about the degree to which it reflects the “recovery” from the mini-Ice Age (when there were Ice Fairs on the Thames among other events not seen today) and the effects of increased CO2 emissions.

The controversial part is the removal of temperature oscillations commonly thought to have occurred over the course of the past 2,000 years. These include warming that was known to have occurred in Roman times and again in the tenth century when the Vikings colonised Greenland until 1250, and the cold period 1400-1700.  Such events are downgraded as being either exaggerated or localised.

The earlier iteration of the IPCC 2021 picture was the notorious hockey stick fabrication by Michael Mann.  Mann cherry-picked data from tree rings and spliced together incongruent data sources, and reported his “findings” in a 1998 paper. Like the latest IPCC report, this showed a flat temperature trend until the 20th Century, then a sharp rise.

The IPCC in its 2001 report used Mann’s graph as its poster child to substantiate human-induced global warming.  In the years after 2001 the IPCC quietly dropped Mann’s “hockey stick”.  Its discreditating was completed by 2009 release of confidential emails (dubbed “Climategate”), which showed Michael Mann as the conductor of other climate scientists seeing a need to eradicate the “medieval warming period” in order to make the case that the modern warming is unique.

The chicanery under which this strategy was conducted resulted in legal cases.  Canadian scientist Tim Ball called Mann a fraud, Mann sued and the subsequent court case lasted a decade before finding against Mann. (Mann has managed to string out another case that he brought against Mark Steyn for even longer).

But in the 2021 climate review the “hockey stick” is again the main feature.