Archives par mot-clé : Antartica

Study Claims Ice Sheet Melt After Last Ice Age Faster Than Expected, Sans SUV

by E. Utter, Apt 11, 2023 in ClimateChangeDispatch


According to a recently released study, at the end of the last ice age, parts of an enormous ice sheet covering Eurasia retreated up to 2,000 feet per day.

That rate is the fastest measured to date, far exceeding what scientists previously believed to be the upper limits for ice sheet retreat. [emphasis, links added]

In the new study, lead author Christine Batchelor and her colleagues analyzed former beds of two major ice streams across the Norwegian continental ice shelf dating back 15,000 to 19,000 years ago.

Using ship-borne imagery, the team then calculated the rates of retreat by studying patterns of wavelike ridges along the seafloor.

They hypothesized that the “orderly” ridge patterns they observed may have been created as the front of the glacier bounced on the seafloor from daily tides.

Call me a skeptic, but this doesn’t sound to me like “settled science.”

Nonetheless, Batchelor and crew think the finding may shed light on how quickly ice in Greenland and Antarctica might melt — and raise global sea levels — in a warming world.

Batchelor stated: “If temperatures continue to rise, then we might have the ice being melted and thinned from above as well as from below, so that could kind of end up with a scenario that looks more similar to what we had [off] Norway after the last glaciation.”

According to a story in The Washington Post, Eric Rignot, a glaciologist who was not involved in the study, opined on it anyway, stating via email:

This is not a model. This is real observation. And it is frankly scary. Even to me.” (Cue the voice of Elmer Fudd. “Yes, it is vewy, vewy, scawy, Rignot.” Not.

The only thing the study proves is that the Earth warmed quickly and dramatically eons agowithout any possible help from man.

The Observatory Antarctic Sea Ice: ‘The beginning of the end!’ – again

by Dr D. Whitehouse, March 2, 2023 in NetZeroWatch


CNN are not the only media outlets to report on this years’ record low sea ice around Antarctica in apocalyptic terms, other media extremists are available. For Sky News it’s the accelerating melt of polar regions. For the BBC “There is now less sea-ice surrounding the Antarctic continent than at any time since we began using satellites to measure it in the late 1970s.” All this is technically true, but misleading. When it’s put into context one sees a different picture.

So let’s have a look at the actual satellite data of Antarctic sea ice collected monthly since 1979. The NSIDCgives two data sets for what it calls i) sea ice extent, and ii) sea ice area. So let’s examine both of them.

The first graphs is sea ice area, the second sea ice extent.

From the empirical data it is evident that there is hardly any change of sea ice over the 44-year time span. Since 2016 there is a dip with possibly more variability (of which more later), and the lowest month (February) does show a record low, but by hardly anything (and also look at the data for 1992). Does this actual data look like the beginning of the end to you? Where is CNN’s 90% loss or Sky News acceleration?

Millions of sq km; Source: National Snow & Ice Data Center

New Study Affirms Anthropogenic CO2 Emissions Play No Role In Larsen Ice Shelf Melt

by K. Richard, Oct 3, 2022 in NoTricksZone


There are four main reasons why Antarctica’s Larsen C Ice Shelf may be melting. None of them involve human forcing or CO2 concentration changes.

Scientists have recently completed an exhaustive 20-year study of the “most significant causes of melting” of the Larsen C Ice Shelf in the Antarctic Peninsula. They have concluded the 4 main surface melt drivers are:

1. Shortwave solar radiation.

2. Foehn wind variations.

3. Cloud cover changes.

4. Natural circulation variations (SAM, ENSO).

Neither anthropogenic forcing nor CO2 emissions are listed as causal factors in Antarctic ice melt processes.


In other words, there is nothing even remotely unusual about any Antarctic ice melt or climate trends that cannot be explained by or attributed to natural, non-anthropogenic processes.

Ultra-depleted hydrogen isotopes in hydrated glass record Late Cretaceous glaciation in Antarctica

by D.A. Nelson et al. , Sept 7, 2022 in NatureCommunications


Abstract

The Early Jurassic Butcher Ridge Igneous Complex (BRIC) in the Transantarctic Mountains contains abundant and variably hydrated silicic glass which has the potential to preserve a rich paleoclimate record. Here we present Fourier Transform Infrared Spectroscopic data that indicates BRIC glasses contain up to ~8 wt.% molecular water (H2Om), and low (<0.8 wt.%) hydroxyl (OH) component, interpreted as evidence for secondary hydration by meteoric water. BRIC glasses contain the most depleted hydrogen isotopes yet measured in terrestrial rocks, down to δD = −325 ‰. In situ 40Ar/39Ar geochronology of hydrated glasses with ultra-depleted δD values yield ages from 105 Ma to 72 Ma with a peak at c. 91.4 Ma. Combined, these data suggest hydration of BRIC glasses by polar glacial ice and melt water during the Late Cretaceous, contradicting paleoclimate reconstructions of this period that suggest Antarctica was ice-free and part of a global hot greenhouse.

More Proof That Geologic Forces Are Melting Thwaites and Pine Island Glaciers

by J.E. Kamis, July 20, 2020 in ClimateChangeDispatch


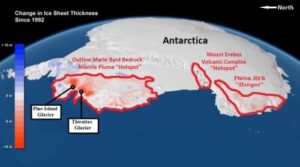
As previously explained before, increased melting/ice loss of Antarctica’s Pine Island and Thwaites glaciers is the result of geologically induced heat flow emitted from underlying bedrock “hotspots,” not climate change (Figure 1).

All but a very minor amount of Antarctica’s glacial ice melting occurs in the western portion of this continent. The most rapid and greatest ice mass loss areas are in West Antarctica.

They are positioned directly above geographically extensive and high heat flow geological features. This association is thought to be strong evidence of a cause and effect relationship.

Discussion of evidence supporting the contention that the melting of Pine Island and Thwaites glaciers is the result of bedrock heat flow begins with a review of the regional geology (refer to Figure 1).

The Pluton Rich “hotspot” is a 61,000-thousand-square-mile area that is home to numerous high-heat-flow lava pockets that are bounded and fueled by deep earth reaching faults.

Several detailed research studies document the existence and configuration of this area. This lies along the West Antarctic Rift.

The Mount Erebus Volcanic Complex “Hotspot” is the most geologically active portion of Antarctica. It is a 25,000-square-mile high-heat-flow area, much of which is absent of glacial ice.

The absence of glacial ice across a huge portion of West Antarctica is extremely unusual and exceedingly difficult to explain by invoking global warming.

Figure 1. NASA map of Antarctica’s ice sheet thickness 1992-2017. Greatest ice thickness losses shaded red. The outline of three regional sub-glacial geological Hotspots” are outlined in red (Image by NASA, most labeling by J. Kamis).