
by Roy Spencer, December 12, 2019 in WUWT
I keep getting asked about our charts comparing the CMIP5 models to observations, old versions of which are still circulating, so it could be I have not been proactive enough at providing updates to those. Since I presented some charts at the Heartland conference in D.C. in July summarizing the latest results we had as of that time, I thought I would reproduce those here.
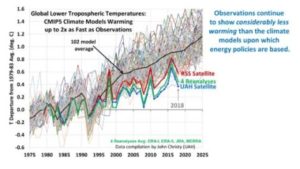
The following comparisons are for the lower tropospheric (LT) temperature product, with separate results for global and tropical (20N-20S). I also provide trend ranking “bar plots” so you can get a better idea of how the warming trends all quantitatively compare to one another (and since it is the trends that, arguably, matter the most when discussing “global warming”).
From what I understand, the new CMIP6 models are exhibiting even more warming than the CMIP5 models, so it sounds like when we have sufficient model comparisons to produce CMIP6 plots, the discrepancies seen below will be increasing.
Global Comparisons
First is the plot of global LT anomaly time series, where I have averaged 4 reanalysis datasets together, but kept the RSS and UAH versions of the satellite-only datasets separate. (Click on images to get full-resolution versions).
…