Archives par mot-clé : Extreme events

‘Hurricane Season Slowest Start In 30 Years’: Media Spin Begins

by A. Watts, Aug 29, 2022 in ClimateChangeDispatch


Back in May, many media outlets ran with this headline courtesy of a press release from NOAA:

NOAA predicts above-normal 2022 Atlantic Hurricane Season

Media outlets like Houston Public Media trumpeted it as if it was fact, saying: [bold, links added]

The National Oceanic and Atmospheric Administration (NOAA) released its 2022 Atlantic Hurricane Forecast, predicting an “above normal” hurricane season.

NOAA says there is a 70% chance of 14-21 storms forming, with as many as ten potentially becoming hurricanes. Three to six of these storms could become major hurricanes.

Nothing Alarming: Europe Data Show No Upward Trend In Droughts And Forest Fires

by P. Gosselin, Aug 24, 2022 in NoTricksZone


German online NOVO-Argumente looks at the forest fire situation in Germany and Europe.

Currently parts of Europe are experiencing severe drought conditions and forest fires are raging in Germany. Climate activists and the mainstream are claiming it’s climate change, and it’s unprecedented.

But NOVO-Argumente looks at the historical data going back decades and finds nothing alarming.

Over the long-term average (1993 to 2019), 1035 forest fires in Germany were recorded with an average of 656 hectares affected. The amount of damage is just 1.38 million euros. Forest fires therefore cost us about as much per year as we spend every 30 minutes on subsidizing solar and wind energy.

“No evidence of an increase in forest fires”

As the following graph shows, there is no evidence of an increase in forest fires over the last 30 years in terms of number and extent. The peaks are not seen in this chart from the Federal Environmental Agency because they are in the past. In 1975, over 8000 hectares burned in Lower Saxony alone. In contrast, in the year 2021, which is not yet recorded in the graph, there were only 548 forest fires in the whole of Germany on a total area of 148 hectares.

Welfare in the 21st century: Increasing development, reducing inequality, the impact of climate change, and the cost of climate policies

by B. Lomborg, July 2020 in TechForecSocChange


Abstract

Climate change is real and its impacts are mostly negative, but common portrayals of devastation are unfounded. Scenarios set out under the UN Climate Panel (IPCC) show human welfare will likely increase to 450% of today’s welfare over the 21st century. Climate damages will reduce this welfare increase to 434%.

Arguments for devastation typically claim that extreme weather (like droughts, floods, wildfires, and hurricanes) is already worsening because of climate change. This is mostly misleading and inconsistent with the IPCC literature. For instance, the IPCC finds no trend for global hurricane frequency and has low confidence in attribution of changes to human activity, while the US has not seen an increase in landfalling hurricanes since 1900. Global death risk from extreme weather has declined 99% over 100 years and global costs have declined 26% over the last 28 years.

Arguments for devastation typically ignore adaptation, which will reduce vulnerability dramatically. While climate research suggests that fewer but stronger future hurricanes will increase damages, this effect will be countered by richer and more resilient societies. Global cost of hurricanes will likely decline from 0.04% of GDP today to 0.02% in 2100.

Climate-economic research shows that the total cost from untreated climate change is negative but moderate, likely equivalent to a 3.6% reduction in total GDP.

Climate Expert: What The Media Won’t Tell You About Droughts

by R. Pileke Jr, Aug 16, 2022 in ClimateChangeDispatch


Europe is in the midst of what has been called the worst drought in 500 years. According to a drought expert with the European Commission in comments last week [bold, links added]:

“We haven’t analysed fully the event (this year’s drought), because it is still ongoing, but based on my experience I think that this is perhaps even more extreme than 2018. Just to give you an idea the 2018 drought was so extreme that, looking back at least the last 500 years, there were no other events similar to the drought of 2018, but this year I think it is really worse than 2018.”

While a full analysis of the ongoing 2022 European drought remains to be completed, so too the drought itself, which is clearly exceptional if not unprecedented. In this post, I take a close look at the state of understanding of the possible role of climate change in this year’s drought.

Specifically, I report on what the most recent assessment report (AR6) of the Intergovernmental Panel on Climate Change (IPCC) and underlying literature and data say about the detection of trends in Western and Central European drought and the attribution of those trends to greenhouse gas emissions.

The figure below shows the specific region that is the focus of this post, which includes all of Germany, most of France, Hungary, Poland, Ukraine, and western Russia among other nations. …

Europe wildfires: Are they linked to climate change?–NO!!!

by P. Homewood, Aug 15, 2022 in NotaLotofPeopleKnowThat


The BBC would like you to think so, with statements like these:

So far this year, the amount of land burnt by fires across the European Union is more than three times greater than what you would expect by the middle of July.

Almost 346,000 hectares (1,370 sq miles) of land have been recorded as burnt (as of 16 July), according to the European Forest Fire Information System (EFFIS).

Much of Western Europe has been hit by a record-breaking heatwave, which substantially increases the risk of fires….

“Heatwaves and droughts are exacerbated by climate change and are absolutely the defining factor in years with massive wildfire outbreaks, like the present one,” Dr Jones says….

“But we definitely see trends in fire weather risk because of climate change.

“The risk is higher in the Mediterranean region than the rest of Europe.”

Studies show increasing fire risk for central and southern regions of Europe over the past couple of decades.

Yet tucked away in the same article is this graph which proves all of these have no basis in fact:

Pacific Typhoons Defy Climate Experts’ Dire Forecasts…Trending Downward 70 Years!

by P. Gosselin, Aug 6, 2022 in NoTricksZone


Pacific typhoons have been trending downward for 70 years 

The Japan Meteorological Agency (JMA) presents the latest data for Pacific typhoons — going back to 1951.

This summer climate alarmists in Europe have been chasing “heat waves”, likely because hurricanes and typhoons have been on the quiet side.

Today we look at the data from the Japan Meteorological Agency (JMA) for the number of typhoons formed in the Pacific in the month of July, now that the July data are available:


Clearly the world has warmed somewhat since 1951, but contrary to what the climate bedwetters claim, the trend in typhoons has been downward – suggesting that a warmer climate leads to less Pacific storms in terms of typhoons formed. This is the opposite of what climate “experts” said would happen.

Next we look at the number of typhoons formed in the Pacific from January to July, going back to 1951:


Little evidence of changes in extreme weather trends

by P. Homewood, July 27, 2022 in NotaLotofPeopleKnowThat


New IPCC attribution statistics are distorting observational evidence

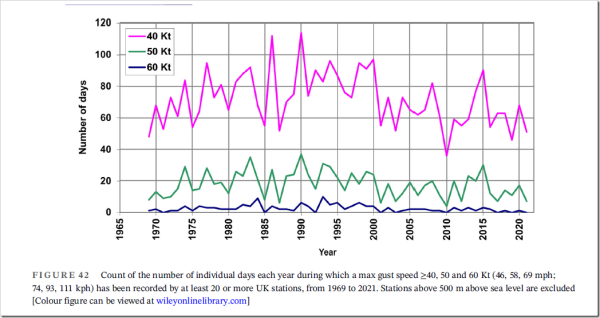
London, 27 July – A new paper from the Global Warming Policy Foundation finds that the IPCC’s recent shift in methodology has led to misleading claims about changes in weather extremes.

The review, from physicist Dr Ralph Alexander, finds that IPCC claims that many of these weather extremes are increasing significantly are largely unsupported by observational evidence.

Ralph Alexander: Extreme Weather: The IPCC’s Changing Tune (pdf)

According to Dr Alexander:
“On almost every kind of extreme weather, with the possible exemption of heatwaves, the evidence for significant changes is scant. But the latest IPCC report has introduced novel ‘attribution’ statistics and now insists that things are getting worse. It’s yet another case of scientists trying to scare the public into compliance.”

Dr Alexander’s paper looks at:
– droughts
– floods
– hurricanes
– tornadoes
– wildfires
– hot and cold extremes
– coral bleaching.

He concludes that:
“The mistaken belief that weather extremes are worsening because of climate change is more a perception, fostered by media coverage, than reality. The IPCC’s new statistical method is playing an unworthy part in bringing this sorry state of affairs to pass.”

GWPF invited the Royal Society and the Met Office to review this paper, and to submit a response to be published as an appendix to it. No reply was received.

Think it’s hot now? How Britain roasted in TEN-WEEK heatwave during summer of ’76

by P. Homewood, Jul 15, 2022 in NotaLotofPeopleKnowThat


Wildfires have raged, speed restrictions have been imposed on some railway lines and hospitals have already declared ‘critical incidents’.

The hot weather in Britain this summer is set to peak next week, when the mercury could top 39C (102F) in London.

The current non-stop sunshine has evoked memories of the summer of 1976, when there were 15 consecutive days that saw temperatures of 89.6F (32C) somewhere in the UK.

Overall, there were ten weeks of blazing heat that saw widespread drought, mass standpipe use, and even the pausing of the murder trial of the notorious ‘Black Panther’, after a woman suffering from ‘heat exhaustion’ collapsed.

During a First Division football match between Manchester City and Aston Villa, City player collectively lost four stone in weight, prompting the team’s captain to call for an end to ‘summer soccer’.

At that year’s Wimbledon tennis championships, umpires were allowed to remove their jackets for the first time in living memory, whilst major roads were littered with broken-down cars that had overheated.

The extreme weather also caused an increase in the number of 999 callouts to domestic disturbances, as tempers buckled due to the heat.

The summer of 1976 was caused in part by very hot air that had originated in the Mediterranean. The warm weather and lack of rain began on June 23 and did not abate for more than a month.

The highest temperature recorded in the summer was on July 3, when the mercury hit 96.6F (35.9C) in Cheltenham. The average maximum daily temperature was 67.8F (19.9C).

Declining tropical cyclone frequency under global warming

by S. Chand et al., Jun 27, 2022 in Nature


Abstract

Assessing the role of anthropogenic warming from temporally inhomogeneous historical data in the presence of large natural variability is difficult and has caused conflicting conclusions on detection and attribution of tropical cyclone (TC) trends. Here, using a reconstructed long-term proxy of annual TC numbers together with high-resolution climate model experiments, we show robust declining trends in the annual number of TCs at global and regional scales during the twentieth century. The Twentieth Century Reanalysis (20CR) dataset is used for reconstruction because, compared with other reanalyses, it assimilates only sea-level pressure fields rather than utilize all available observations in the troposphere, making it less sensitive to temporal inhomogeneities in the observations. It can also capture TC signatures from the pre-satellite era reasonably well. The declining trends found are consistent with the twentieth century weakening of the Hadley and Walker circulations, which make conditions for TC formation less favourable.

Climate Change Weekly #439: Hurricanes Not Increasing, Despite Warming

by H.S. Burnett, Jul 1, 2022 in WUWT


Pielke notes five points of fact about hurricanes:

  1. The Intergovernmental Panel on Climate Change (IPCC) finds “no consensus” on the relative role of human influences on Atlantic hurricane activity, quoting the IPCC as follows: “there is still no consensus on the relative magnitude of human and natural influences on past changes in Atlantic hurricane activity, … and it remains uncertain whether past changes in Atlantic TC activity are outside the range of natural variability.”
  2. “The IPCC has concluded that since 1900 there is ‘no trend in the frequency of USA landfall events.’ This goes for all hurricanes and also for the strongest hurricanes, called major hurricanes.”
  3. “Since at least 1980, there are no clear trends in overall global hurricane and major hurricane activity.”
  4. “There are many characteristics of tropical cyclones that are under study and hypothesized to be potentially affected by human influences, … but at present there is not a unified community consensus on these hypotheses, as summarized by the World Meteorological Organization,” as to whether any of the factors are affected by human greenhouse gas emissions.
  5. “Hurricanes are common, incredibly destructive and will always be with us. Even so, we have learned a lot about how to prepare and recover.”

Pielke points out that some of the costliest hurricanes occurred in the early part of the twentieth century when average global temperatures were cooler than at present.

Warming Could Lead To Fewer Tornadoes… Trend Has Been Downward 70 Years, Less Damage

by P. Gosselin, Mar 13, 2022 in NoTricksZone


A rational look at the data and physics tell us there are no real signs that tornadoes are going to get more frequent and worse.

German Die kalte Sonne’s 2nd part of its most recent video looks at tornadoes, a ferocious and extremely destructive meteorological phenomenon that global warming alarmists claim will only get worse and worse. They want6 you to panic over it.

But Die kalte Sonne’s video report notes that a number of sources say that trend has yet to materialize. Many statistics in fact have shown the opposite is happening:


Ideal conditions for tornado formation could weaken

The ideal conditions that lead to the formation of tornadoes are lower warm moist air clashing with cold dry air moving above. The conditions are common in the springtime, when warm, humid air from southern USA clashes with a cold air mass blasting in from the north. Yet, should the these cold masses of air warm up, then this would lead to a smaller temperature gradient and thus be less favorable for tornadoes to form.

Increasingly Powerful Tornadoes???

by Robert Vislocky, Dec 29, 2021 in WUWT


After every tragic meteorological event there will inevitably be the alarmist cries that climate change was a substantial influence. The recent late-season tornado outbreak of Dec 10-11 is no exception. Usually most of these are appeals to emotion with no data to support the relationship between extreme weather and climate change. However, this tweet from Michael Mann pointed to a 2019 peer-reviewed study titled “Increasingly Powerful Tornadoes in the United States” by Elsner et al.1

Glasgow Is Fake…Number Of Typhoons Formed In Pacific Has Trended Downward Significantly Since 1951!

by P. Gosselin, Nov 12, 2021 in NoTricksZone


The Glasgow climate conference has been a three-ring circus of doomsday clowns, all warning of ever increasing extreme weather events. But as hurricane trends have shown, most of it is baseless hysteria.

Pacific typhoons trending downward

As the 2021 tropical cyclone season for the northern hemisphere approaches its end, the Japan Meteorological Agency (JMA) presents the latest data for Pacific typhoons — going back to 1951.

Urban areas more likely to have precipitation-triggered landslides, exposing growing populations to slide hazards

by American Geophysical Union, Oct 12, 2021 in ScienceDaily


Urban areas may be at greater risk for precipitation-triggered landslides than rural areas, according to a new study that could help improve landslide predictions and hazard and risk assessments.

Landslides cause thousands of deaths and billions of dollars of damage annually. With over half of the world’s population in urban areas, and both urbanization and precipitation extremes expected to increase in the future, understanding how urban landscapes are affected by precipitation-triggered landslides is a pressing need.

The new study used a large database of precipitation-triggered landslides across the Pacific coast of the U.S. and isolated the influence of precipitation changes using a specific type of computer model. When the researchers controlled for other factors, like slope steepness, rock type, and wildfire, they found that urban landslide hazard was up to 10 times more sensitive to variations in precipitation than in rural areas. That means that the same increase in rainfall in rural and urban areas could be 10 times more likely to cause a landslide in a city.

The new research is published in the AGU journal Geophysical Research Letters, which publishes high-impact, short-format reports with immediate implications spanning all Earth and space sciences.

Where Have All The Disasters Gone?

by W. Essenbach, Oct 14, 2021 in WUWT


I read today that the EU is using an estimate of US$68 per tonne of CO2 emissions for the purported cost of the damages done by CO2. This is known by a Newspeak term as the “Social Cost Of Carbon”.

It made me wonder—using this estimate, what is the overall total estimated damage done by humans from emitting CO2?

The answer is $97 TRILLION dollars since 1950.

YIKES! That’s about five times the 2020 US Gross Domestic Product (the value of everything produced in the US during that year).

So I thought I’d take a look at the various largest weather-related disasters. I got the big-disaster data from Wikipedia here and arranged it by type of disaster. All values are in 2020 dollars, that is to say, they’re adjusted for inflation. Here is the result.

Températures extrêmes et foehn – Démonter le mythe des ‘dômes de chaleur’

by B. Van Vliet-Lanoë et J. Van Vliet, 27 août 2021, in ScienceClimat Energie


EN GUISE DE CONCLUSIONS

Les températures extrêmes observées en juin 2021 en Colombie britannique et dans le Nord-Ouest américain s’expliquent quantitativement et de manière classique par le gradient vertical de 9,8 K/km de l’adiabatique sèche, associé à une baisse d’altitude de 2 km, par l’intermédiaire d’un phénomène de foehn autocatalytique.Les concepts de « dôme de chaleur » et de Global Warming ne sont donc d’aucune utilité pour interpréter les observations. 

De manière plus générale, le phénomène de foehn peut être déclenché par la présence de hautes pressions dans le voisinage d’une chaîne de montagnes. La chaîne des Montagnes Rocheuses est particulièrement sujette à ces phénomènes depuis la Colombie britannique jusqu’à la Californie, mais elle est loin d’être la seule, comme le montre le Tableau 13. Le vent de foehn chaud et sec favorise également les incendies de forêts.

La genèse des hautes pressions peut résulter du passage d’ondes planétaires, mais également du passage d’AMP en provenance du vortex polaire. Ce dernier est particulièrement renforcé lorsque le vent solaire – ou l’activité aurorale qui lui est équivalente – faiblit, comme c’est le cas entre la fin d’un cycle solaire et la montée de l’activité du cycle suivant (Schlamminger 1990). Ceci explique pourquoi les hautes pressions et les vagues de froid sont particulièrement intenses au début du cycle solaire, comme déjà observé entre 2009 et 2013, et comme attendu entre 2019 et 2023. Il est donc probable que les phénomènes extrêmes et les incendies de forêts se poursuivront dans les 2 ou 3 années qui viennent. 

Enfin, les différents phénomènes physiques évoqués se situent non pas dans un contexte de réchauffement, mais bien dans un contexte de refroidissement global qui a démarré avec le 21ème siècle (van Vliet 2020) et que le printemps froid et l’été pluvieux de 2021 rendent particulièrement visible en Belgique, en France, en Angleterre et en Allemagne.

Dans cet article, une analyse quantitative simple nous a conduit à la conclusion que les températures extrêmes et les feux de forêt sont d’origine naturelle : l’homme n’y est donc pour rien, sauf pour la gestion de la couverture végétale et … l’allumage. Il est faux de juger l’homme coupable comme le font systématiquement l’ONU et le GIEC.

Oser prétendre que la transition énergétique améliorera cette situation relève d’une alliance contre nature entre le monde politique, le marketing insensé des énergies renouvelables et la propagande écologiste.

Criminal Negligence? Authorities Failed To Heed Flood Warnings…”Let People Drown”…”Monumental System Failure”

by P. Gosselin, July 17, 2021 in WUWT/NTZ


Harsh criticism of German authorities failing to act is mounting in the aftermath of the recent deadly floods.

Germany’s New Orleans

Many of the over one hundred people died in the recent flood disaster in Central Western Germany could have been prevented – had the responsible institutions heeded the warnings that had been already issued days in advance by the weather services. Authorities had been warned days early, yet they did nothing to prepare to evacuate and mobilize resources. The media did nothing to warn.

Veteran meteorologist: “much could have been prevented”

Swiss meteorologist Jörg Kachelmann told in a PULS 24 interview that “much of it could have been prevented” and that “people could have been warned”.

“The rainfall could not have been prevented” but the authorities and the “media could have warned the population.” The veteran Swiss meteorologist is surprised by the “surprise of the authorities” and says “people could have been evacuated or at least items moved to higher floors”.

Let people drown” as “they broadcast shit”

Kachelman also commented to Germany’s leading national dailyBild: “It hurts when the very people who would have the resources to accompany such a weather situation 24/7 do nothing to save lives. But they broadcast shit and let people drown.”

Unpreparedness becoming a German habit

CO2 Cyclone Doomsday Flat Out Refuted: 170 Years “Absolutely No Trend” In Hurricane Intensity/Frequency

by P. Gosselin, May, 22, 2021 in NoTricksZone


The latest comes from statistics expert, Zoe Phin, who looks at the alarmists’ claim that increasing CO2 emissions are leading to more frequent and intense Atlantic hurricanes.

Alarmist claims cost nothing, and so easily made. Zoe Phin looks at whether the hurricane alarmist claim holds up.

Frequency

First Zoe looked at the (HURDAT2) data to find out if the first of the two claims (increasing frequency) is true. At first glance it would appear so.

But Zoe asks if the method of measuring the frequency really is sensible and if it maybe weren’t better to measure the amount of time the Atlantic spends in hurricane mode? To find out, Zoe plotted the hurricane hours data and the 10-year moving average:

Source: Zoe Phin.

….

Climate Catastrophe In The 17thC – Geoffrey Parker

by P. Homewood, Apr 9, 2021 in NotaLotofPeoppleKnowThat


Amazon’s blurb sets the scene:

Revolutions, droughts, famines, invasions, wars, regicides – the calamities of the mid-seventeenth century were not only unprecedented, they were agonisingly widespread.  A global crisis extended from England to Japan, and from the Russian Empire to sub-Saharan Africa. North and South America, too, suffered turbulence. The distinguished historian Geoffrey Parker examines first-hand accounts of men and women throughout the world describing what they saw and suffered during a sequence of political, economic and social crises that stretched from 1618 to the 1680s. Parker also deploys scientific evidence concerning climate conditions of the period, and his use of ‘natural’ as well as ‘human’ archives transforms our understanding of the World Crisis. Changes in the prevailing weather patterns during the 1640s and 1650s – longer and harsher winters, and cooler and wetter summers – disrupted growing seasons, causing dearth, malnutrition, and disease, along with more deaths and fewer births. Some contemporaries estimated that one-third of the world died, and much of the surviving historical evidence supports their pessimism.


Amongst these catastrophic events, Parker lists:


Early 17thC

1) West Africa, from the Sahel in the north to Angola in the south, suffered a prolonged drought between 1614 and 1619.

2) Catalonia suffered “the year of the flood” in 1617.

3) All Europe experienced an unusually cold winter in 1620/21, when many rivers froze so hard for 3 months that they could bear the weight of loaded carts; even the Bosphorus froze, an unheard of event.

4) Japan suffered its coldest spring of the century in 1616, while the sub tropical region of Fujian in China had heavy snowfall two years later, another extremely rare event.

5) Droughts in five years out of six between 1616 and 1621 almost the destroyed the new colonies in Virginia.

6) After a few better years, the summer of 1627 in Europe was the wettest for 500 years, followed by the “year without a summer” in 1628, when it was so cold that many crops never ripened.

7) Between 1629 and 1632, much of Europe suffered excessive rains, followed by drought.

8) Conversely, northern India suffered a “perfect drought” in 1630/31, followed the next year by catastrophic floods.

Parker notes that “all of these regions experienced dramatic falls in population

New Study: 100-Year Flood Events Have Decreased Globally Since 1970

by  K. Richard, Apr 6, 2021 in ClimateChangeDispatch


In contrast to alarming claims about rare, 100-year flood events now occurring every few years due to global warming, scientists have determined the exact opposite is more likely true.

Not only have flood frequencies declined globally in the last 50 years, but the probability of a 100-year flood event is now so rare it has only been occurring once every 358 years on average since 1970.

According to the IPCC, there has been no clear evidence of a global-scale increase in flood magnitude or frequency in the last century (Hodgkins et al., 2017).

A new study (Slater et al., 2021) suggests that claims of flood magnitude, frequency, and probability dramatically increasing with global warming can be “misleading” if they use a stationary calculation approach instead of continually updating significant changes over time.

These scientists, using “observed annual maximum daily streamflow” records and a “nonstationary approach,” concluded there has been no obvious global-scale trend in 20-, 50-, and 100-year flood magnitude since 1970, with 100-year flood events defined as “flows of a given exceedance probability in each year.

NOAA’s Climate Disaster Claims Are A Sham

by C. Rotter, Feb 20, 2021 in WUWT


When a hurricane hits a populated stretch of coast, which is almost invariably, it is inevitable losses will be big. But while last year was a busy year for hurricanes, we do know that the frequency of US hurricanes has not been unusual in the last decade, and if anything the long term trend is down. (Though it is worth noting that the 1980s and 90s were below average, making the choice of 1980 as a start date statistically inappropriate):

De Telegraaf Misled By UN Disaster Report Researcher

by P. Homewood, Oct 20, 2020 in NotaLotofPeopleKnowThat


You will all recall the latest UN report, which claimed there had been a massive rise in “reported disasters” in the last two decades, compared to the previous two.

The Dutch newspaper, De Telegraaf, published an article in response complaining that the UN were not comparing like with like, because many smaller disasters were simply never recorded in the past. They also published this reply from Joris van Loenhout, researcher at the Belgian Centre  for  Research on the Epidemiology of Disasters  (CRED):

“From about 1960-1970 onward, the completeness of the data is much greater, and the share of missing disasters much smaller. We are constantly working to improve completeness, and this is also happening for previous years and decades. For this reason, statements made in 2004 and 2006 are now somewhat outdated, as the completeness of the database has since improved,”

 I have now had time to analyse CRED’s database, EM-DAT, and have the figures to show that Loenhout has not been telling the truth.


In their 2004 report, “Thirty Years of Natural Disasters”, CRED included this table of the number of natural disasters: