by P. Homewood, Mar 29, 2023 in NotaLotofPeopleKnowThat
This study seems to have gone under the radar last year:
…
https://doaj.org/article/df360f90269148b181055b409cd38204
So in short, under high emission scenarios, they reckon that the Antarctic ice cap will actually grow, with heavier snowfall more than offsetting glacial melt, leading to lower sea levels. And even under lower emissions the rate of melt will still be lower than currently.
Indeed according to scientists like Jay Zwally, the Antarctic ice cap has actually been growing in recent decades, for precisely this reason.
by Eric Worrall, May 7, 2020 in WUWT
According to climate scientists, less dense meltwater on the surface of the Antarctic ocean reduced convection between the surface and ocean depths, leaving heat trapped in the depths.
A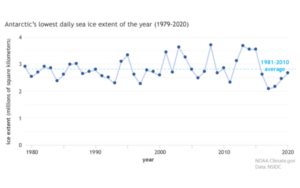
…
Don’t you love climate science? When sea ice accumulates, scientists adjust the models until they get the right result. When the sea ice melts, well that is what you would expect from global warming.
by N. Vizcarra, February 2020 in EarthData/NASA
Paul Holland, a climate modeler with the British Antarctic Survey, has spent the last ten years studying Antarctica’s sea ice and the Southern Ocean. Lately, he has been scrutinizing the seasons of Antarctica and how fast the ice comes and goes. Holland thinks these seasons may be a key to a conundrum: If Earth’s temperatures are getting warmer and sea ice in the Arctic has been shrinking fast, why then is sea ice in the Antarctic slowly increasing?
…
…
Spring surprise
Holland used data from NASA’s National Snow and Ice Data Center Distributed Active Archive Center (NSIDC DAAC) to calculate the ice concentration rate of growth for each single day, which he called intensification; and the total ice area rate of growth, which he called expansion. “I did that for all thirty years of data and plotted the trends,” he said. Holland’s plots showed that the different regions in the Southern Ocean contributed to the overall increase, but they had very diverse trends in sea ice growth. This suggested that geography and different wind patterns played a role. So to gain more insight Holland looked at seasonal wind trends for the different regions.
Holland found that winds were spreading sea ice out in some regions and compressing or keeping it intact in others and that these effects began in the spring. It contradicted a previous study in which, using ice drift data, Holland and Ron Kwok from the NASA’s Jet Propulsion Laboratory (JPL) found that increasing northward winds during the autumn caused the variations.
“I always thought, and as far as I can tell everyone else thought, that the biggest changes must be in autumn,” Holland said. “But the big result for me now is we need to look at spring. The trend is bigger in the autumn, but it seems to be created in spring.”
“Paul has created two more sea ice metrics that we can use to assess how Antarctic sea ice is responding,” said researcher Sharon Stammerjohn, referring to the measures of intensification and expansion. The new metrics help assess how the system is responding as opposed to simply monitoring the state of the system. “Say your temperature is at 99.2 degrees Fahrenheit,” Stammerjohn said. “You don’t have any insight to that temperature unless you take it again an hour later and you see that it changed to 101 degrees. Then you can say, okay, my system is responding to something.”
by P. Homewood, August 29, 2019 in NotaLotofPeopleKnowThat
You will recall those ridiculous stories about Greenland heatwaves and ice sheet meltdown, which were circulating just a couple of weeks ago :
…
As I pointed out at the time, they were simply not true. And, now the actual data bears this out.
The Surface Mass Balance (SMB) of the ice sheet, while below average is still well above that of 2012, and also within the historical range.. Most of the shortfall this year is because of dry weather during the winter, hence lack of snow.
[The light grey band shows differences from year to year. For any calendar day, the band shows the range over the 30 years (in the period 1981-2010), however with the lowest and highest values for each day omitted. ]
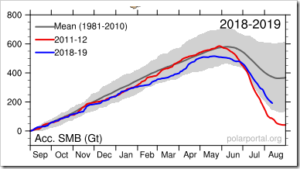
http://polarportal.dk/en/greenland/surface-conditions/
…
by Claire L. Parkinson, July 5, 2019 in WUWT
PNAS first published July 1, 2019 https://doi.org/10.1073/pnas.1906556116
Contributed by Claire L. Parkinson, May 24, 2019 (sent for review April 16, 2019; reviewed by Will Hobbs and Douglas G. Martinson)
Significance
A newly completed 40-y record of satellite observations is used to quantify changes in Antarctic sea ice coverage since the late 1970s. Sea ice spreads over vast areas and has major impacts on the rest of the climate system, reflecting solar radiation and restricting ocean/atmosphere exchanges. The satellite record reveals that a gradual, decades-long overall increase in Antarctic sea ice extents reversed in 2014, with subsequent rates of decrease in 2014–2017 far exceeding the more widely publicized decay rates experienced in the Arctic. The rapid decreases reduced the Antarctic sea ice extents to their lowest values in the 40-y record, both on a yearly average basis (record low in 2017) and on a monthly basis (record low in February 2017).
Abstract
Following over 3 decades of gradual but uneven increases in sea ice coverage, the yearly average Antarctic sea ice extents reached a record high of 12.8 × 10⁶ km2 in 2014, followed by a decline so precipitous that they reached their lowest value in the 40-y 1979–2018 satellite multichannel passive-microwave record, 10.7 × 10⁶ km2, in 2017. In contrast, it took the Arctic sea ice cover a full 3 decades to register a loss that great in yearly average ice extents. Still, when considering the 40-y record as a whole, the Antarctic sea ice continues to have a positive overall trend in yearly average ice extents, although at 11,300 ± 5,300 km2⋅y−1, this trend is only 50% of the trend for 1979–2014, before the precipitous decline. Four of the 5 sectors into which the Antarctic sea ice cover is divided all also have 40-y positive trends that are well reduced from their 2014–2017 values. The one anomalous sector in this regard, the Bellingshausen/Amundsen Seas, has a 40-y negative trend, with the yearly average ice extents decreasing overall in the first 3 decades, reaching a minimum in 2007, and exhibiting an overall upward trend since 2007 (i.e., reflecting a reversal in the opposite direction from the other 4 sectors and the Antarctic sea ice cover as a whole).
…
Fig. 1. Identification of the 5 sectors used in the regional analyses. These are identical to the sectors used in previous studies (7, 8).
by P. Homewood, June 20, 2019 in NotaLotofPeopleKnowThat
…
…
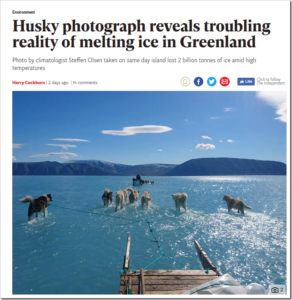
The first thing to point out is that this is nothing to do with Greenland’s ice sheet, despite the misleading inference to that effect in the first paragraph. It is in fact fjord ice, which freezes every winter and melts every summer.
This year it is beginning to melt slightly earlier than usual, because of warm air moving up from the south. This is called “weather”, and has nothing to do with “global warming”.
As is noted, such weather is not unprecedented. Indeed, the temperature peak of 17.3C is not even unusual for Qaanaaq, where the record is set at 20C.
…
See also here
by William Ward, April 18, 2019 in WUWT
The world is drowning in articles about catastrophic sea level rise (SLR), reminding us that if the ice sheets melt, 260 feet of water will flood our coastal cities. We know that sea level today is 20-30 feet lower than it was at the end of the last interglacial period 120,000 years ago. We also know that sea level has risen 430 feet since the end of the last glacial maximum 22,000 years ago. Research shows this rise was not monotonic but oscillatory, and during periods over the past 10,000 years, sea level has been several meters higher than today. So, evidence supports the possibility of higher sea levels, but does the evidence support the possibility of catastrophic sea level rise from rapidly melting ice?
In this paper, basic science is used to show that catastrophic SLR from melting ice cannot happen naturally over a short period. Additionally, humankind does not possess the capability to melt a large amount of ice quickly even through our most advanced technology. This news should relieve the public, which is routinely deceived by reporting that misrepresents the facts. The public is susceptible to unnecessary alarmism when melt rates and ice-melt masses are presented without perspective and juxtaposed against claims that scientists are worried. This paper uses the same facts but places them in perspective to show that catastrophic risks do not exist.
…
by Kenneth Richard, November 15, 2018 in NoTricksZone
The year 2018 could mark the beginning of the end of climate change alarmist reporting. Projections of catastrophic melting of the ice sheets and sea level rise swallowing up the Earth’s coasts are increasingly undermined by observation.
…
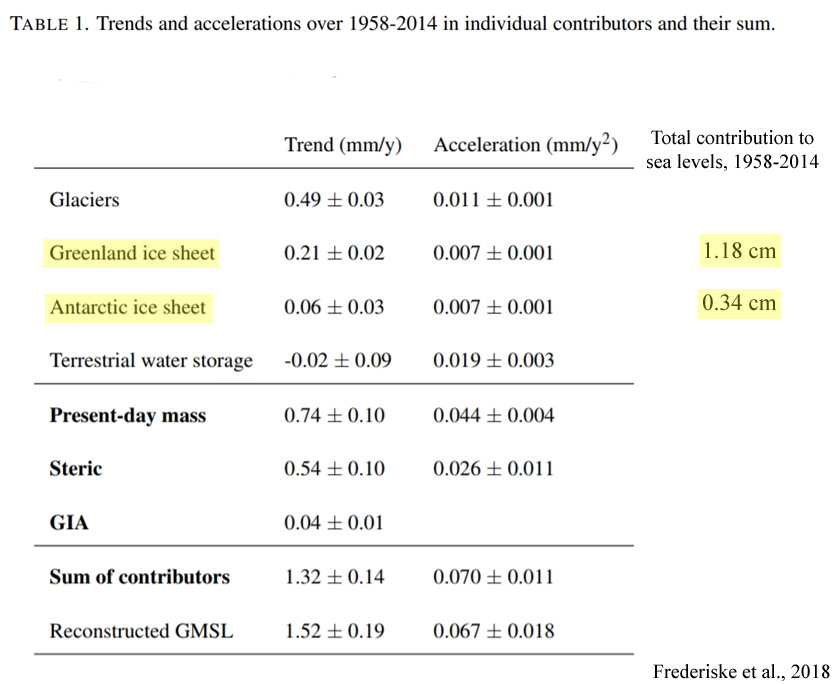
Despite the hackneyed practice of reporting “staggering” ice sheet melt for both Greenland and Antarctica in recent decades, the two polar ice sheets combined to add just 1.5 centimeters to sea level rise between 1958 and 2014 (graphfrom Frederikse et al., 2018) as global sea levels only rose by “1.5 ± 0.2 mm yr−1 over 1958–2014 (1σ)” or “1.3 ± 0.1 mm yr−1 for the sum of contributors”.
That’s about 7.8 centimeters (3.1 inches) of global sea level change in 56 years.
…
La géologie, une science plus que passionnante … et diverse
