by J. Goslin in P. Gosselin, June 1, 2019 in NoTricksZone
Another new paper, which of course will be ignored by the government-funded IPCC because it contradicts claims CO2 drives climate, shows that natural factors dominated the earth’s climate variability.
Not surprisingly, as evidenced by hundreds of other publications (which are entirely ignored by the IPCC), climate variability is indeed tied to solar activity and “internal atmospheric and oceanic modes”.
If we speak of an average of the last 23 cycles in the months of the minimum, our only significant energy source at the center of the solar system was below average active last month as well.
The sunspot number (SSN) was 9.1, which was thus only 42% of the average of the cycles for month no. 125. Some cycles (No. 21, 18, 16, 15, 8 ) were already completed in month no. 125.
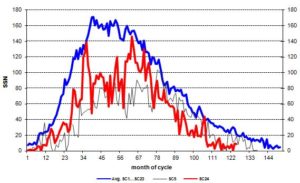
Fig. 1: The monthly sunspot activity of the current solar cycle (SC 24) since December 2008 (red) compared to the mean value of all previously systematically observed cycles since the beginning of SC 1 in March 1755 (blue) and the very similar SC 5 (black).
Figure 1 clearly shows that the latest cycle was quite below-normal, especially at the beginning and after the second peak which had an SSN of over 140 towards the end. Since February 2014 (the maximum of the entire cycle 24 with SSN = 146 in cycle month 63), it only reached 2/3 of the average activity.
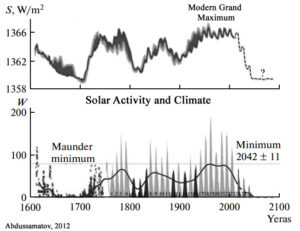
What are the effects? The total radiation (TSI for total solar irradiance) is only moderately influenced:
The sun was also very sub-normally active in February. Although we are in the middle of the minimum, the sunspot number of 0.8 for the 123rd month into the cycle is very low. On 26 days of the month no spots were visible, only on 2 days was there a little, symmetrically distributed over both solar hemispheres.The only exciting question currently: When will the minimum be finished and will solar cycle 25 begin? Although 6 spots of the new cycle were already visible in February with a significantly higher resolution, estimates are difficult.March again was dominated by some spots of the “old” SC24. The rule: “weaker cycles often last longer than stronger cycles” could hold.
…
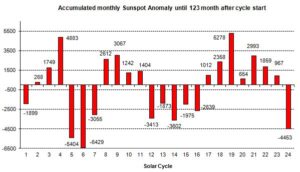
Figure 2: The strength of the sunspot activity of each cycle in comparison. The numbers in the diagram are obtained by adding up the monthly deviations between the observed values and the mean value (blue in Fig.1) up to the current 123rd cycle month.
Figure 2 shows that five cycles (No. 8, 15, 16, 18, 22) did not have a month 123 at all. Instead the following cycle started. In this respect, the picture is now somewhat distorted towards the end of the cycle.
Our sun was also very sub-normally active in December last year. We are writing the 121st month since the beginning of cycle number 24, in December 2008, and since 2012 (when we started the blog here) we could only reformulate the opening sentence once: In September 2017 when the sun was 13% more active than the long-term (since 1755) average.
All other months were below average. With the sunspot number (SSN) of 3.1 for the monthly average for December and a total of 24 days without any spot (throughout the second half of the month the sun was spotless) we are in the middle of the cycle minimum.
…
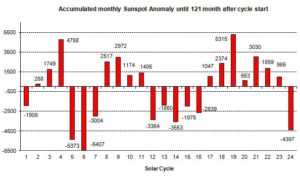
Fig. 2: The sunspot activity of our sun since cycle 1 (1755). The numbers are calculated by adding the monthly differences with respect to the mean (blue in Fig.1) up to the current cycle month 121.
The sun was much less active in November than normal, comparing all solar cycles 1-23 up to month no. 120 since the beginning of the systematic survey in 1755, the first year of solar cycle 1.
The latest observed SSN (sunspot number) was a meager 5.9 for the monthly average.
On 16 days the sun was completely “spotless.” The maximum number over the days of November was 15, which does not mean that there were 15 spots – no, the number indicates that 5 spots were observed in a maximum of 1 spot group.
So there was very low spot activity, only 20% of the average value.
When it comes to the Sun’s influence on climate, one conclusion is certain: there is no widespread scientific agreement as to how and to what extent solar activity and its related parameters (i.e., galactic cosmic rays, geomagnetic activity, solar wind flux) impact changes in the Earth’s temperature and precipitation.
The disagreement is so chasmic and the mechanisms are so poorly understood that scientists’ estimates of the influence of direct solar irradiance forcing between the 17th century and today can range between a negligible +0.1 W m-2 to a very robust +6 W m-2 (Egorova et al., 2018; Mazzarella and Scafetta, 2018).
“There is no consensus on the amplitude of the historical solar forcing. The estimated magnitude of the total solar irradiance difference between Maunder minimum and present time ranges from0.1 to 6 W/m2 making uncertain the simulation of the past and future climate.” (Egorova et al., 2018)
by Paul Dorian, November 5, 2018 in PerspectaWeather
Overview
The sun is blank again today and has been without sunspots about 60% of the time this year as the current historically weak solar cycle heads towards the next solar minimum. Solar cycle 24 is currently on pace to be the weakest sunspot cycle with the fewest sunspots since cycle 14 peaked in February 1906. Solar cycle 24 continues a recent trend of weakening solar cycles which began with solar cycle 21 that peaked around 1980. The last time the sun was this blank in a given year on a percentage basis was 2009 during the last solar minimum when 71% of the time was spotless. That last solar minimum actually reached a nadir in 2008 when an astounding 73% of the year featured a spotless sun – the most spotless days in a given year since 1913. All indications are that the fast-approaching next solar minimum may be even quieter than the last one which was the deepest in nearly a century.
One of the natural consequences of a solar minimum is for the upper part of the Earth’s atmosphere to cool down. Another natural impact of decreasing solar activity is the weakening of the ambient solar wind and its magnetic field which, in turn, allows more cosmic rays to penetrate the solar system. The intensification of cosmic rays can have important consequences on such things as the safety of airline passengers and astronauts in space, Earth’s cloud cover and climate, and possibly even on lightning.
…
Daily observations of the number of sunspots since 1 January 1977 according to Solar Influences Data Analysis Center (SIDC). The thin blue line indicates the daily sunspot number, while the dark blue line indicates the running annual average. The recent low sunspot activity is clearly reflected in the recent low values for the total solar irradiance. Compare also with the geomagnetic Ap-index. Data source: WDC-SILSO, Royal Observatory of Belgium, Brussels. Last day shown: 31 October 2018. Last diagram update: 1 November 2018.
La géologie, une science plus que passionnante … et diverse